Having analyzed the process dump in part 1, let’s take a look at the code we suspect of causing the issue, in particular how race condition bugs can be avoided.
Looking at the User Code
There were three methods in action, all of them in the SettingDescriptionCache class: GetAllDescriptions, init and GetAllDescriptionsAsDictionary. GetAllDescriptions and GetAllDescriptionsAsDictionary are for all intents and purposes identical and both implement a pattern like this:
public static IEnumerable<SettingDescriptionContainer> GetAllDescriptions(IPartnerConfig partnerConfig)
{
	// Optimistic return. If it fails we'll populate the cache and return it.
	try
	{
		return cache[partnerConfig.PartnerID].Values;
	}
	catch (KeyNotFoundException)
	{
		init(partnerConfig);
	}

	return cache[partnerConfig.PartnerID].Values;
}
Both methods access a static variable defined in the class like so:
private static readonly Dictionary<short, Dictionary<SettingDescription, SettingDescriptionContainer>> cache =
	new Dictionary<short, Dictionary<SettingDescription, SettingDescriptionContainer>>();
As this code is being called quite a lot, it’s written using an optimistic pattern that assumes the cache is populated. This is faster than checking if the cache is populated beforehand, or performing a TryGet(). I’ve previously blogged about why you shouldn’t defend against the improbable.
Dictionaries are Not Thread Safe
Looking up the MSDN article on thread-safe collections, you’ll notice the following paragraph describes how the standard Dictionary collections are not thread-safe:
The collection classes introduced in the .NET Framework 2.0 are found in the System.Collections.Generic namespace. These include List<T>, Dictionary<TKey, TValue>, and so on. These classes provide improved type safety and performance compared to the .NET Framework 1.0 classes. However, the .NET Framework 2.0 collection classes do not provide any thread synchronization; user code must provide all synchronization when items are added or removed on multiple threads concurrently.
But is this the issue we’re running into? As there are two dictionaries in action, either one of them could potentially be the culprit. If the partnerConfig.PartnerID value was the same there would be a somewhat higher chance of this really being the issue - but how can find out what PartnerID values were being passed in to the methods?
Analyzing Method Parameters Using Windbg
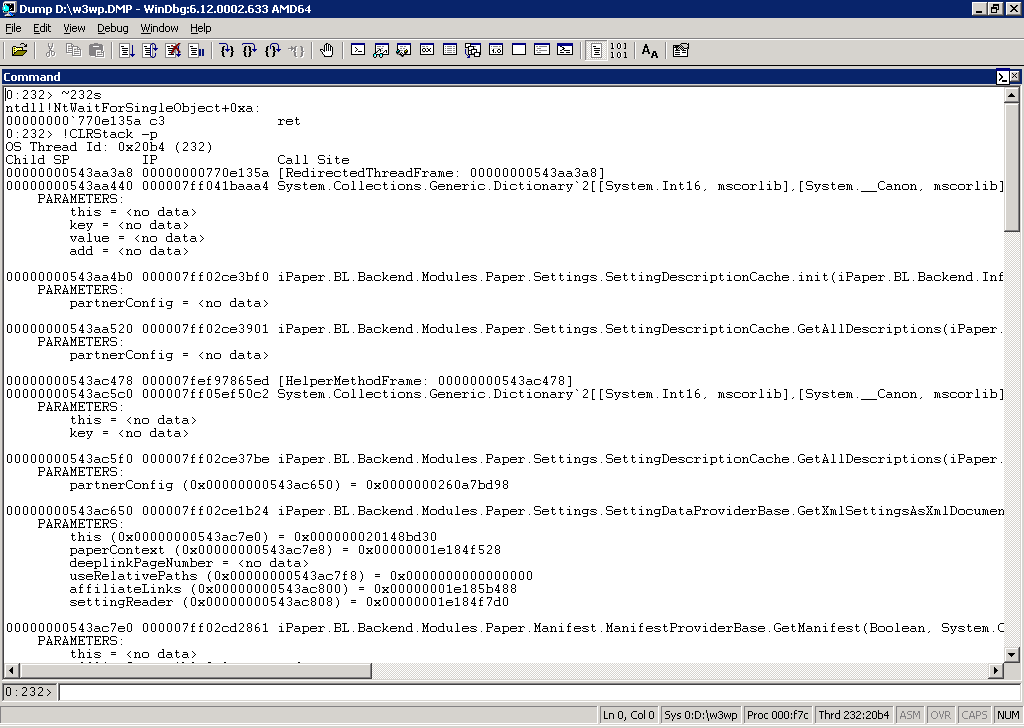
Back in Windbg, for each of the threads we can run the !CLRStack command once again, but with the -p parameter. This doesn’t just list the stack trace, but also all of the parameters for each frame.
~232s
!CLRStack -p
In the fifth frame, there’s a value for the IPartnerConfig parameter:
iPaper.BL.Backend.Modules.Paper.Settings.SettingDescriptionCache.GetAllDescriptions(iPaper.BL.Backend.Infrastructure.PartnerConfiguration.IPartnerConfig)
	PARAMETERS:
		partnerConfig (0x00000000543ac650) = 0x0000000260a7bd98
The left side value is the local memory address of the pointer itself whilst the right side is the memory location where the actual PartnerConfig instance is stored. By issuing the do (dump object) command, we can inspect the value itself:
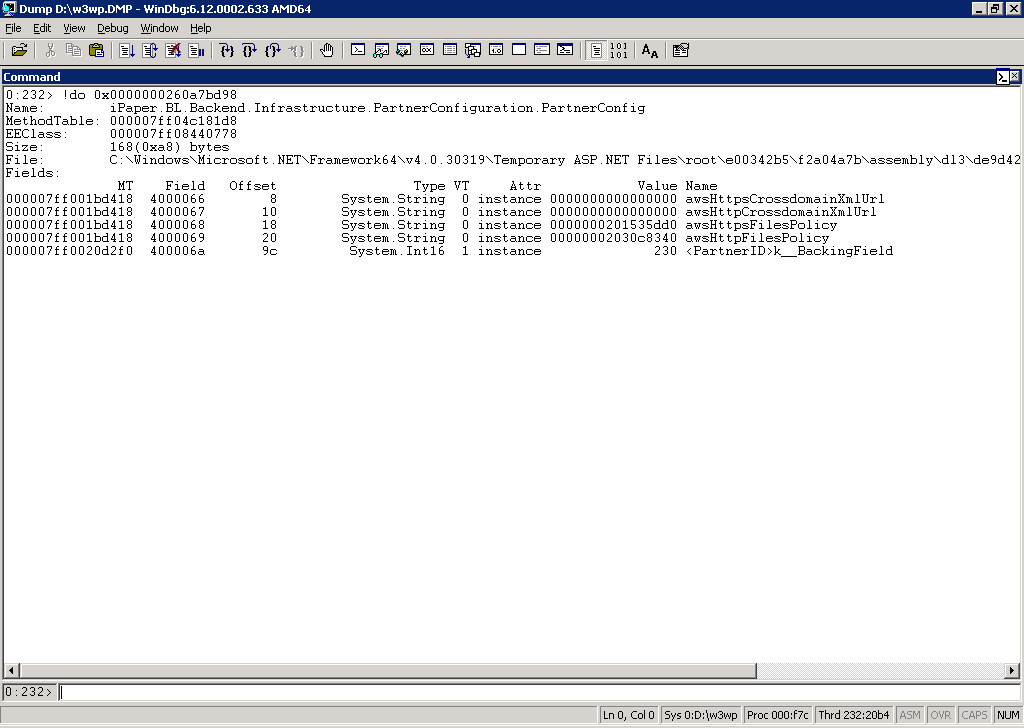
!do 0x0000000260a7bd98
If you look under the Name column then you’ll be able to pinpoint the individual fields in the PartnerConfiguration instance. In the Value column you can see that the PartnerID field has a value of 230. Doing this for the other four threads yields the same result - all of them are trying to access the cache value belonging to the PartnerID value of 230!
At this point I can quite confidently say that I’m sure this is a threading issue related to the non thread-safe Dictionary usage. I would’ve expected hard failures like like KeyNotFoundException, NullReferenceException and so on. But apparently, under the exact right race conditions, the dictionaries may get stuck at 100% CPU usage.
Stay tuned for part 3 where I’ll show how to use the Dictionaries in a safe way that avoids issues like these!

