Recently I’ve been working on a project where I’ve got millions of relatively small objects, sized between 5kb and 500kb, and they all have to be uploaded to S3. Naturally, doing a synchronous upload of each object, one by one, just doesn’t cut it. We need to upload the objects in parallel to achieve acceptable performance. But what are the optimal parameters when it comes to the number of simultaneous upload threads? Does it depend on the object size? How much of a difference does HTTPS over HTTP make? Let me share what I discovered during my testing.
Note that some of these graphs are much larger than what I can show in-page. All can be opened in full size by clicking them.
Test code
To reduce variance in the outcome, I’ve run all test cases four times and reported the average runtime. Each test case tries to upload 512 objects of a given size. In total, 2048 objects are uploaded across the four repetitions, before the average runtime is reported back. Even though I ran four repetitions, I still saw some fluctuations in the results that I’ll have to attest to variance.
I started out by using the thread pool and the asynchronous Begin/EndPutObject methods. However, even when setting the thread pool max/min thread/IO settings explicitly, I found the thread pool usage caused too much variance. Instead I went with manual thread control.
One major player is the ServicePointManager.DefaultConnectionLimit – this limits the number of active connections to any given host at the same time. By default, this has a low value of 2 and thus limits you to just two concurrent uploads to S3, before others are queued at the network level. If this limit is set below the number of active threads, you will invariably have threads waiting to open network connections. To avoid this, I set the connection limit equal to the number of threads I was running.
I tried running the tests both with and without MD5 checksum generation & verification, but I saw no measurable difference in the outcome.
At no point, in any of the test environments, were the CPUs stressed to the point where they were close to becoming bottlenecks. As the test object is all in-memory and no disk is involved, I’ve ruled out disks as a bottleneck factor as well. Thus, the number one of piece of hardware affecting the results is the network interface card (NIC).
Before starting the four repetitions of the test, I fire off a single PutObject request to warm up the stack. The test code is relatively simple, it runs in an infinite loop, checking whether we need to upload more objects, or whether we’re done. If done, it breaks the loop and ends the thread. When launching I start up X amount of threads and immediately after join with them to wait for them all to complete. The runtime includes the amount of time required to instantiate the threads, though it should have no measurable impact on the result. The runtime calculation is done using integer math for output simplicity, but the impact should be minimal in the big picture.
using System;
using System.Collections.Generic;
using System.Configuration;
using System.Diagnostics;
using System.Net;
using System.Threading;
using Amazon;
using Amazon.S3;
using Amazon.S3.Model;

namespace S3Optimization
{
	class Program
	{
		private const string bucketName = "improve.dk";
		private const string serviceUrl = "s3-eu-west-1.amazonaws.com";

		// ConnectionLimit ObjSizeInKB
		static void Main(string[] args)
		{
			int repetitions = 4;
			int uploadCount = 512;
			int objSize = Convert.ToInt32(args[1]) * 1024;
			int numThreads = Convert.ToInt32(args[0]);
			string dir = "Optimization/" + Guid.NewGuid();
			var config = new AmazonS3Config().WithServiceURL(serviceUrl).WithCommunicationProtocol(Protocol.HTTPS);
			var sw = new Stopwatch();
			object locker = new object();
			string obj = randomString(objSize);

			// Ensuring all connections have network connectivity
			ServicePointManager.DefaultConnectionLimit = numThreads;

			// The actual job each thread will be performing
			var work = new ThreadStart(() =>
				{
					using (var s3Client = AWSClientFactory.CreateAmazonS3Client(ConfigurationManager.AppSettings["AccessKeyID"], ConfigurationManager.AppSettings["SecretAccessKey"], config))
					{
						while (true)
						{
							lock (locker)
							{
								if (uploadCount <= 0)
									break;
								uploadCount--;
							}

							var request = new PutObjectRequest()
								.WithBucketName(bucketName)
								.WithKey(dir + "/" + Guid.NewGuid())
								.WithContentBody(obj);
							s3Client.PutObject(request);
						}
					}
				});

			// Warmup
			using (var s3Client = AWSClientFactory.CreateAmazonS3Client(ConfigurationManager.AppSettings["AccessKeyID"], ConfigurationManager.AppSettings["SecretAccessKey"], config))
			{
				var request = new PutObjectRequest()
					.WithBucketName(bucketName)
					.WithKey(dir + "/" + Guid.NewGuid())
					.WithContentBody(obj);
				s3Client.PutObject(request);
			}

			// Actual timing
			sw.Start();
			for(int i=0; i<repetitions; i++)
			{
				int originalUploadCount = uploadCount;

				var threads = new List();
				for(int j=0; j<numthreads; j++)="" threads.add(new="" thread(work));="" threads.foreach(x=""> x.Start());
				threads.ForEach(x => x.Join());

				uploadCount = originalUploadCount;
			}
			sw.Stop();

			Console.WriteLine(sw.ElapsedMilliseconds / repetitions);
		}

		static string randomString(int size)
		{
			var rnd = new Random();
			var chars = "ABCDEFGHIJKLMNOPQRSTUVWXYZ";

			char[] buffer = new char[size];

			for (int i = 0; i < size; i++)
				buffer[i] = chars[rnd.Next(chars.Length)];

			return new string(buffer);
		}
	}
}
For running the tests, I’m using the following test runner application, testing all combinations of thread count and object size between 1 and 256/2048 respectively (in powers of 2):
var psi = new ProcessStartInfo("S3Optimization.exe")
    {
        UseShellExecute = false,
		RedirectStandardOutput = true
    };

var connectionLimits = new[] { 1, 2, 4, 8, 16, 32, 64, 128, 256 };
var objSizes = new[] { 1, 2, 4, 8, 16, 32, 64, 128, 256, 512, 1024, 2048 };

foreach(int connectionLimit in connectionLimits)
{
	foreach (int objSize in objSizes)
	{
		psi.Arguments = connectionLimit + " " + objSize;

		var p = Process.Start(psi);
		string output = connectionLimit + "t" + objSize + "t" + p.StandardOutput.ReadToEnd();
		p.WaitForExit();

		Console.Write(output);
		File.AppendAllText("Output.txt", output);
	}
}
Initial results
The first test is done using a colocation (colo) Dell PowerEdge 1950 placed at a Danish ISP in Aarhus, Denmark. The server is running Windows Server 2003 x64 and has a single gigabit NIC with gigabit support throughout the network stack. Note that I won’t be mentioning neither CPU, memory nor disk for any of the machines. Neither of those were ever close to being the bottleneck and are thus irrelevant. Suffice to say – they all had plenty of CPU, memory and disk capabilities. A tracert from the server to the S3 EU endpoint in Dublin looks like this:
Tracing route to s3-eu-west-1.amazonaws.com [178.236.6.31]
over a maximum of 30 hops:

1	1 ms	4 ms	13 ms	89.221.162.249
2	1 ms	1 ms	3 ms	10.1.2.1
3	3 ms	2 ms	2 ms	89.221.161.105
4	<1 ms	<1 ms	<1 ms	92-62-199-177.customer.fuzion.dk [92.62.199.177]
5	<1 ms	<1 ms	<1 ms	87.116.1.157
6	5 ms	4 ms	4 ms	93.176.94.175
7	4 ms	4 ms	4 ms	xe-3-3-0.cph10.ip4.tinet.net [77.67.74.37]
8	47 ms	47 ms	47 ms	xe-2-2-0.dub40.ip4.tinet.net [89.149.181.37]
9	*	*	*	Request timed out.
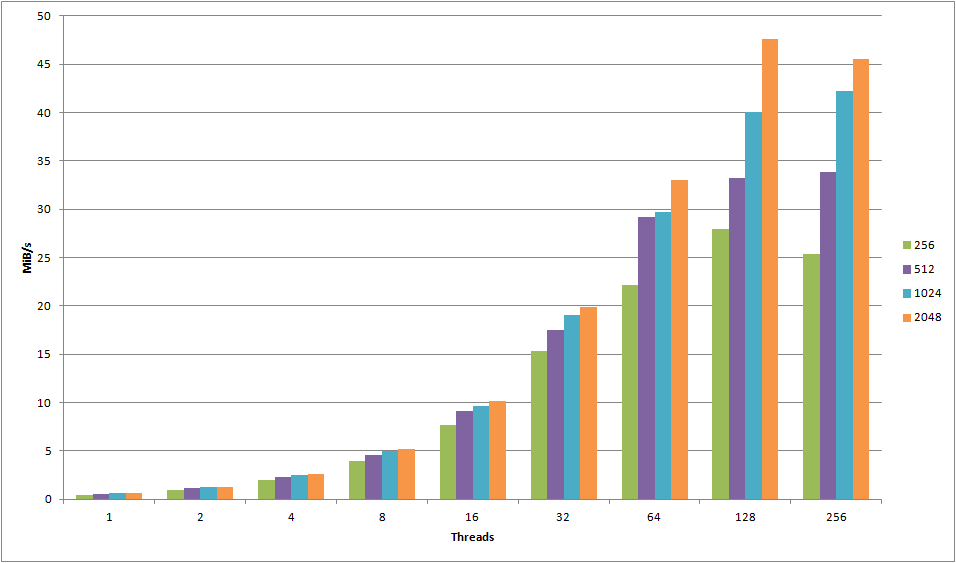
The following graph has the number of threads (that is, simultaneous uploads) on the X-axis and the MiB/s on the Y-axis. The MiB/s was calculated using the formula (UploadCount x ObjectSizeInKB / 1024 / AvgTimePerRepetitionInSeconds). Each color bar represents a given object size in KB as noted on the legend on the right. Note also that these results were made using the standard HTTPS protocol. You might ask yourself why I’m measuring MiB/s and not requests/s. Thing is – they’re exactly the same. MiB/s and requests/s are just calculations based on the time it took to run a fixed number of requests. The absolute values are less interesting than they are in relation to each other. If you want to take a look at the requests/sec, you can download my raw data at the end of the post.
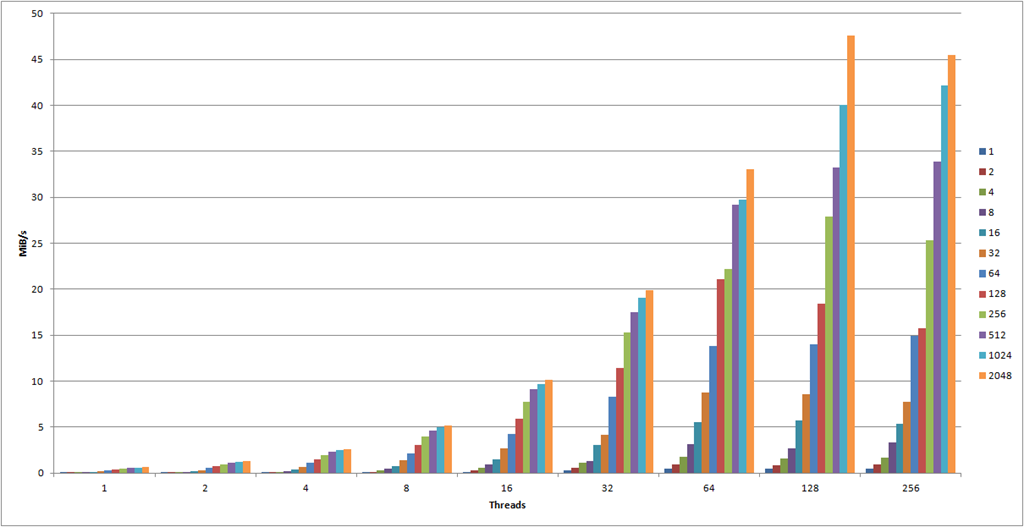
There is an overwhelming amount of information in this graph alone. We can see how the general throughput seems to increase relatively linearly along the amount of threads, though they seem to reach their max potential at 128 threads.
Small object characteristics
Let me zoom in on the 1KB object size:
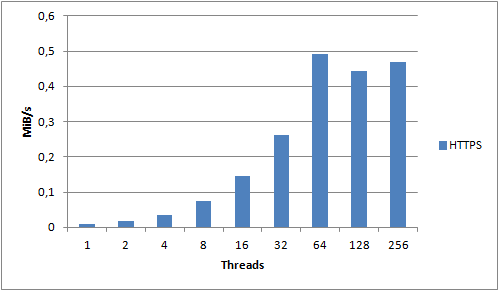
For the 1KB object size we see clear improvements all the way up to 64 threads, after which it seems to stabilize. The 1KB object size is the one that incurs the most overhead due to S3 not utilizing persistent connections. Each request we make needs to create a new TCP connection and perform an SSL handshake. Compared to a 2MB object, we spend a lot more time and resources on overhead compared to actually transferring data. What if we disabled SSL and used unencrypted HTTP instead?
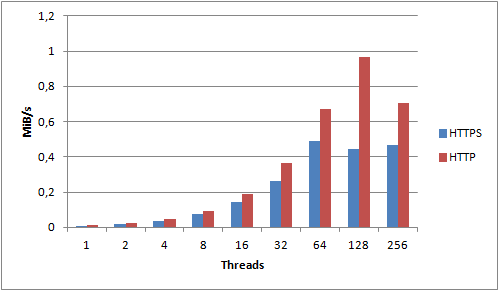
Now we get increased performance all the way up 128 threads – and we actually end up pushing 200% as much data as we did using HTTPS! For small objects, HTTPS has an extremely high cost – you should avoid it if you can.
Number of threads – finding the sweet spot
Take a look at this graph, showing the results for object sizes 1KB – 128KB:
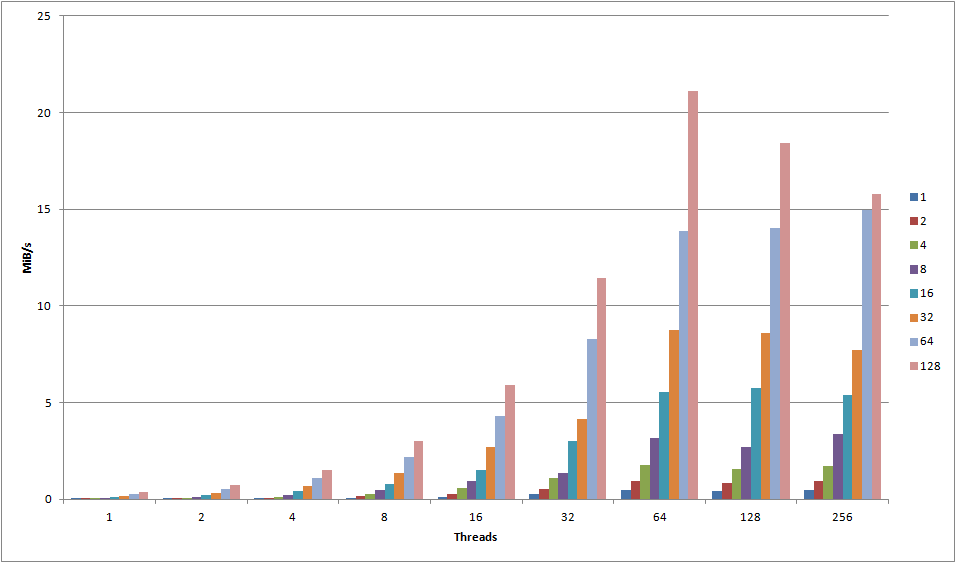
Ignoring minor deviances, all of the objects seem to peak at 64 connections. Any more than that either causes a significant drop off, or just minor variance. For objects less than 128KB, 64 threads definitely seem to be the cut-off point. Compare it with the following graph, showing object sizes 256KB – 2048KB:
For these objects, we clearly see that going up to 128 connections actually provide a boost in throughput, leading me to conclude that for objects of size 256KB+, you can use somewhat more threads successfully.
For all object sizes, using HTTP over HTTPS seems to increase the maximum throughput thread limit – this increasing it from 64 to 128 for smaller objects and from 128 to 256 threads for larger objects. If you’re uploading objects of varying sizes, this means you’ll have to do some testing with your specific workload to find out the optimal amount of threads.
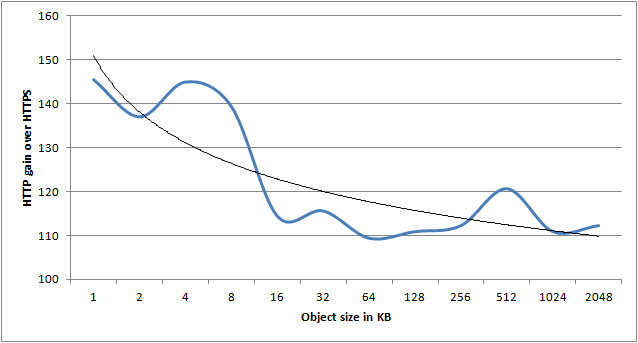
Object size vs. HTTPS performance impact
In the following graph I’ve calculated the average gain HTTP had over HTTPS for each object size, across all thread counts. As there is quite some variance, the trend line is the most interesting part of the graph. It clearly shows that as object size grows, the HTTP over HTTPS advantage decreases.
Server 2008 R2 vs. Server 2003
You’ve probably heard about Server 2008 bringing along a bunch of updates to the TCP/IP stack. I thought it would be interesting to run the same tests on an identical server, just running Windows Server 2008 R2 x64. Luckily, I have just that. A server with identical hardware, on the same subnet at the same ISP, just running Server 2008 R2 x64 instead. Question is, how big of a difference does the OS alone make?
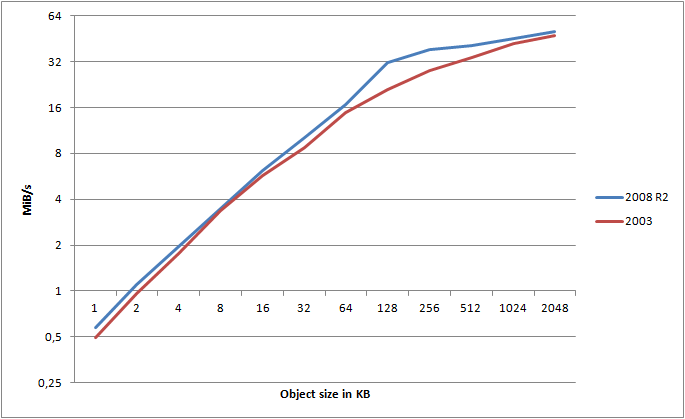
For this graph, I calculated the maximum attainable transfer speed, using HTTPS, for a given object, across any number of threads. I’ve then mapped those values into the graph for both Server 2003 and Server 2008 R2 (note the log(2) scale!).
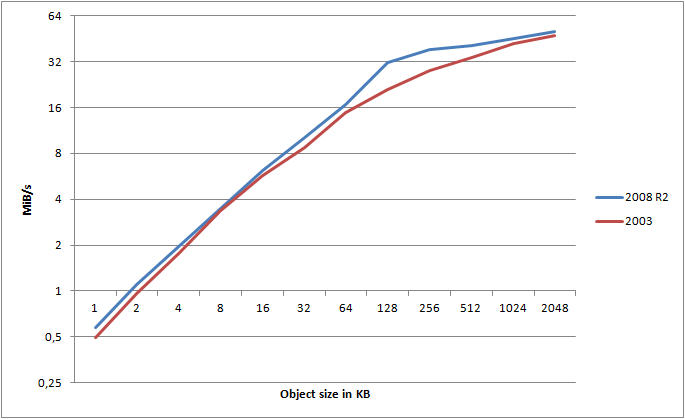
It clearly shows that Server 2008 R2 consistently wins out over 2003 - and this is using the exact same hardware, same switches, connection, etc. - only the OS is different. What about HTTP?
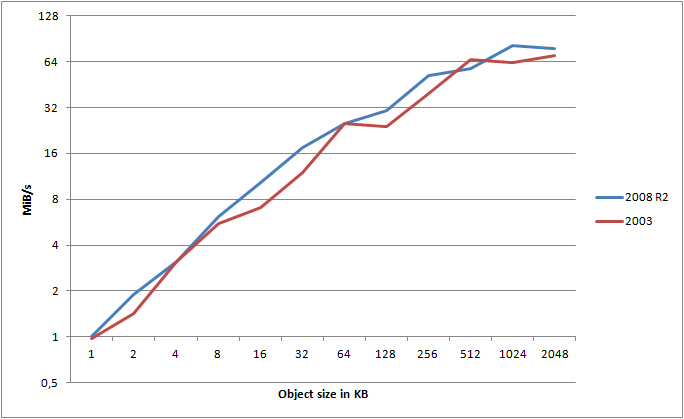
Ignoring some minor variance, HTTP is still clearly the winner.
On average, I found Server 2008 R2 to be 16.8% faster than Server 2003 when testing HTTPS, and 18.7% faster when using HTTP. That is a major gain just by changing the OS!
The impact of locality – EC2 meets S3
At this point I’ve demonstrated that you get rather crappy performance if you perform your uploads single threaded. By just scaling out the number of threads, we can actually end up saturating a gigabit NIC, provided the object size is large enough. However, we do spend a large amount of time waiting for network latency. What difference would it make if we were to run this in the cloud… Say in EC2 for example?
I spawned an m1.xlarge instance in the EU EC2 region, providing me with a stable instance with plenty of CPU and memory. A tracert confirms that we are indeed very close to the S3 servers:
Tracing route to s3-eu-west-1.amazonaws.com [178.236.5.31]
over a maximum of 30 hops:

1	<1 ms	<1 ms	<1 ms	ip-10-48-248-2.eu-west-1.compute.internal [10.48.248.2]
2	<1 ms	<1 ms	<1 ms	ec2-79-125-0-242.eu-west-1.compute.amazonaws.com [79.125.0.242]
3	<1 ms	<1 ms	<1 ms	ip-10-1-44-253.eu-west-1.compute.internal [10.1.44.253]
4	1 ms	2 ms	1 ms	ip-10-1-0-5.eu-west-1.compute.internal [10.1.0.5]
5	<1 ms	<1 ms	<1 ms	ec2-79-125-1-97.eu-west-1.compute.amazonaws.com [79.125.1.97]
6	2 ms	2 ms	2 ms	178.236.0.138
7	2 ms	20 ms	2 ms	178.236.0.123
8	2 ms	2 ms	2 ms	178.236.0.155
9	2 ms	2 ms	2 ms	178.236.5.31
HTTP still wins out over HTTPS
Just to make sure, I compared the average performance of HTTP over HTTPS again. For now, I’m hiding the actual units, and instead I’m just showing the percentage difference. Note that the blue HTTPS line is a baseline performance of 100%.
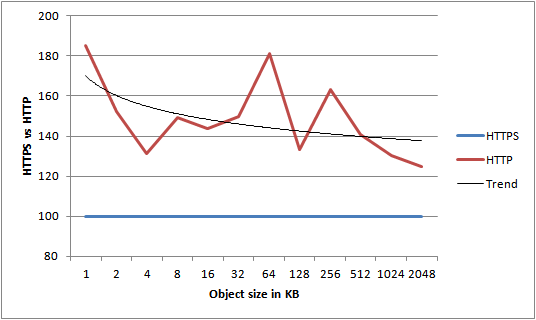
Ignoring variation, we see an average performance improvement of almost 150% compared to HTTPS. From this we can conclude that locality doesn’t change the performance characteristics of HTTP vs. HTTPS – HTTP still wins any day. As a result of this, numbers from now on will be based on HTTP tests, unless explicitly stated otherwise.
Now we’re talking throughput!
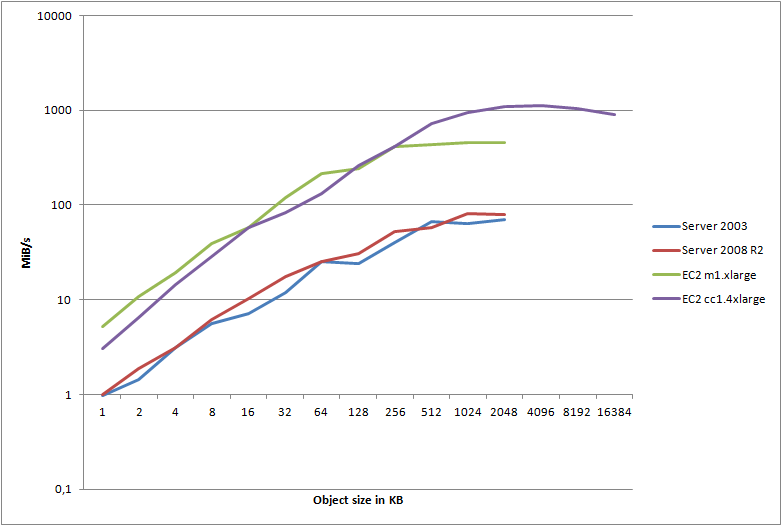
Let’s look at a quick graph detailing the maximum attainable transfer speeds for any given object, comparing my colo Server 2008 R2 server with the m1.xlarge instance run in the AWS EC2 cloud (note the log(10) scale):
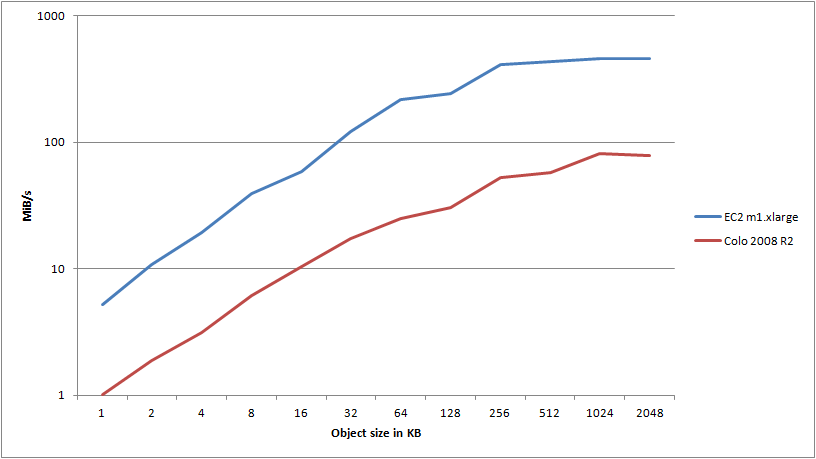
Wow. I redid this test several times as I just couldn’t believe the results. Where my 2008 R2 instance pushed about 1 meg/sec, I was getting 5.2 megs/sec through the EC2 instance. Okay, I guess that’s reasonable since the smaller objects are punished so severely by connection overhead - and that’s the primary advantage of having close locality to the S3 servers, right?
However - once we get to object size 32, we’re now pushing 120 megs/sec from EC2 - at the very border of the 100Mbps NIC that the server reports. But it doesn’t stop there - oh no. I ended up hitting the ceiling at a stable transfer speed of 460 megs/sec, pushing 1024KB objects using 64 threads. But how in the world am I able to push 3,680Mbps through a 100Mbps NIC?
The thing is, these are all just virtual machines sharing physical hardware. The server itself reports 100Mbps, but Amazon will scale your NIC depending on the instance type - typically telling you to expect a worst case of 250Mbps on a large instance. My guess is that these machines are running 10gige internally, and you’ll get whatever is available, though QoS’ed so you’ll get your 250Mbps at a minimum. If that is the case, I can easily pull 3,680Mbps of the theoretically available 10,000Mbps, the rest being used by other VPCs on the same physical network. To all my neighbors during these tests, sorry!
This begs the question though - what if I had that 10gige connection all by myself? What if I didn’t have to share it?
Pushing the limits using compute clusters
If we take a look at the Cluster Compute Quadruple Extra Large Instance (let’s just call it CC from now on) specs, we’re told to expect 10gige network connectivity:
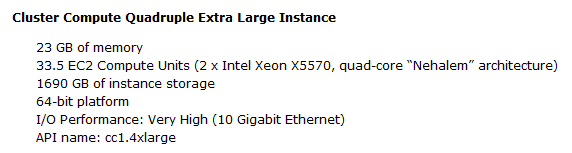
Aha! Just what we need. Unfortunately the CC instances are only available in the US regions, so I had to setup a new bucket in the US, and change my test code to connect to said bucket, from the US. As such, it shouldn’t change anything, though it should be noted that the tests so far have been run in the Dublin DC, whereas this test is run in the North Virginia DC.
Let’s start out by looking at object sizes 1-16KB, comparing the m1.xlarge instance with the cc1.4xlarge instance:
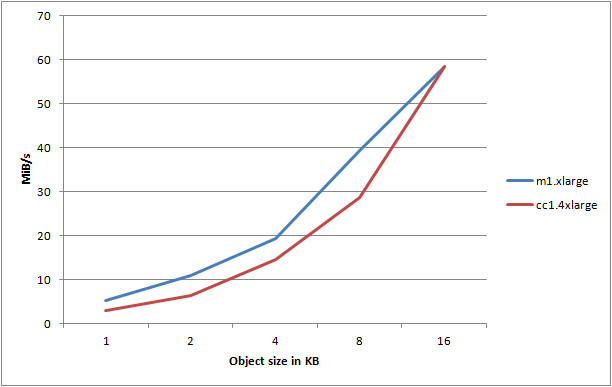
Huh, that’s kinda disappointing. It seems that the CC instance consistently performs worse than the m1.xlarge instance. Let’s try and take a look at object sizes 32-2048KB:
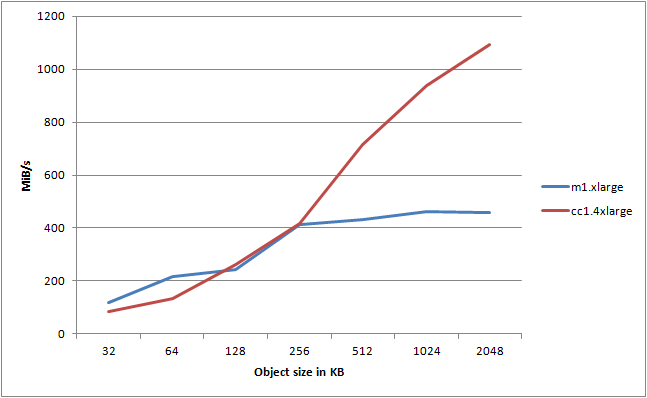
Now we’re talking! As soon as we cross 256KB in object size, we start to saturate the available fabric speed of the m1.xlarge instance - the CC instance on the other hand, it just keeps going up! In this test I reached a max speed of 1091,7 megs/sec using 128 threads pushing objects of 2048KB. That’s 8,733.6Mbps out of a theoretical max of 10,000Mbps - on a single virtualized instance, mind you.
To infinity and beyond
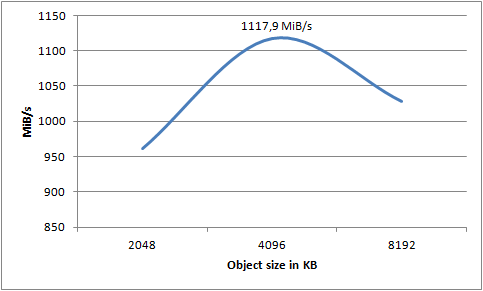
Still not satisfied? Well, neither was I. I tried to tweak the settings a bit more to see if I could push it even further. Given that an object size of 2048KB seemed to improve the result over 1024KB, would an even larger object help? How about more than 128 threads?
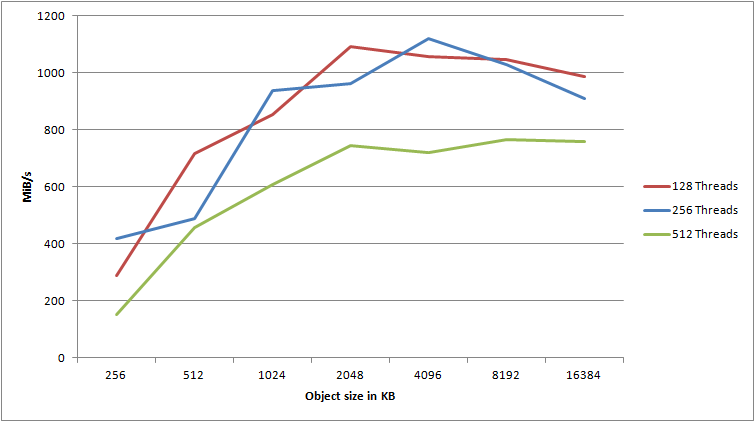
It’s evident that more than 256 threads does not yield any benefit, quite the contrary. However, using 256 threads and an object size of 4096KB, I was able to push 1117,9 megs/sec to S3. I am extremely satisfied with that result. I honestly did not expect to even get 25% of that from a single machine, whether physical or virtual. That’s 8,943,2Mbps of pure data - that is, not including the inevitable network overhead.
Expanding on the results
You can download an Excel sheet of all my raw data, including the various graphs and calculations that I’ve made. Note that all raw numbers are repeated, first sorted by the number of threads, then sorted by the object size. Note also that there are some extra data here and there where I had to do some adhoc tests.
If you want me to create some graphs of a specific scenario, compare two different result sets, environments, etc. - just let me know in the comments. I’ve probably overlooked something interesting as there is just so much data to pull out. Optimally I’d want to run each of these tests for 100 repetitions at different times of the day, just to weed out all of the variance completely. Unfortunately, that would cost me way too much, and it would take ages. I may do some high-rep tests for specific scenarios like the HTTP vs. HTTPS tests as I feel there were too many fluctuations there.
Download: S3Optimization.xlsx
Conclusions
There are a lot of factors to consider when optimizing for upload speed. However, there are just a few rules that you need to follow to reach near-optimal speed with limited effort.
Parallelization
The easiest way to scale is to just parallelize your workload. Each S3 connection doesn’t get that much bandwidth through, but as long as you run many of them at the same time, the aggregate throughput is excellent. Most workloads showed 64, 128 or 256 to be the optimal number of threads.
Locality & bandwidth
Being close to the S3 bucket servers is of utmost importance. As can be seen from the graph, I almost exhausted my 1gige NIC on my colo servers, but I doubt I’d be able to exhaust a 10gige connection (anyone got a server I can borrow for testing?). The graph is slightly misleading though as the EC2 servers had anywhere from 4gige to 10gige of connectivity, so it’s not all just latency - bandwidth certainly matters too, especially once you reach high amounts of thread with large object sizes.
Operating system
Now, you shouldn’t go out and format all of your Server 2003 servers just to get 2008 R2. However, 2008 R2 does consistently perform better than 2003. Though I haven’t tested it, I expect 2008 and 2008 R2 to be about the same. Generally you’ll get about 15% better performance on a 2008 R2 server over a 2003 server.
Saturating the S3 service
Not going to happen, simple as that. I’m utterly amazed at the throughput I managed to gain from just a single machine. At the top, I was pushing more than one gigabyte of data to S3 every second - 1117,9 megs/sec to be precise. That is an awful lot of data, all coming from a single machine. Now imagine you scale this out over multiple machines, and you have the network infrastructure to support it - you can really send a lot of data.
Variance
As can be seen in some of my results, you can’t avoid running into variance when using a cloud service. However, it’s important to look at the baseline numbers - what is the worst case performance you can expect? Not only did my best-case numbers blow my mind, so did the worst-case numbers! Even though performance does fluctuate, the median performance is what matters, and it’s nothing short of impressive.
Optimizing the network stack
I’m certain I’ve left out some percentages by not looking at the NIC drivers and settings. However, generally that’ll be your very last resort, and it’ll only help you get those last few percentages. In most cases there’s no reason to mess around with the remaining 1%, I’ll easily settle for the 99%.