I often do code profiling, usually involving a stopwatch and some boilerplate code. I decided to make a quick’n’simple class that’ll help me get rid of some of that code and concentrate on the actual code being profiled.
There are just four functions in the class, all overload variations. In a nutshell, they’ll allow you to profile a single action with & without warmup, multiple iterations and multiple iterations run i parallel. The code is more or less self explanable so I’ll just throw it out there:
using System;
using System.Collections.Generic;
using System.Diagnostics;
using System.Threading;

namespace CodeProfiler
{
	public class CodeProfiler
	{
		/// <summary>
		/// Measures the runtime of an action once
		/// </summary>
		/// <param name="action">The action to profile</param>
		/// <param name="warmup">Whether the action should be run once before the actual measurement</param>
		/// <returns>The total runtime</returns>
		public static TimeSpan ProfileAction(Action action, bool warmup)
		{
			if (warmup)
				action();

			Stopwatch sw = new Stopwatch();
			sw.Start();
			action();
			sw.Stop();
			return sw.Elapsed;
		}

		/// <summary>
		/// Measures the runtime of an action once, will run the action before to warm up
		/// </summary>
		/// <param name="action">The action to profile</param>
		/// <returns>The total runtime</returns>
		public static TimeSpan ProfileAction(Action action)
		{
			return ProfileAction(action, true);
		}

		/// <summary>
		/// Measures the total runtime of performing the specified action multiple times
		/// </summary>
		/// <param name="action">The action to profile</param>
		/// <param name="iterations">The number of iterations the action should be performed</param>
		/// <returns>The total runtime</returns>
		public static TimeSpan ProfileAction(Action action, int iterations)
		{
			TimeSpan total = new TimeSpan();

			// Perform single warmup
			action();

			// Profile iterations
			for (int i = 0; i < iterations; i++)
				total = total.Add(ProfileAction(action, false));

			return total;
		}

		/// <summary>
		/// Measures the total runtime of performing the specified action using multiple threads
		/// </summary>
		/// <param name="action">The action to profile</param>
		/// <param name="iterations">The total number of iterations that should be profiled</param>
		/// <param name="dop">The number of simultaneous threads that should be used</param>
		/// <returns>The total runtime</returns>
		public static TimeSpan ProfileAction(Action action, int iterations, int dop)
		{
			object locker = new object();
			List<Thread> threads = new List<Thread>(iterations);

			// Warmup
			action();

			// Create profiling threads
			for (int i = 0; i < dop; i++)
			{
				Thread t = new Thread(delegate()
				{
					while (true)
					{
						lock (locker)
						{
							if (iterations > 0)
								iterations--;
							else
								break;
						}

						action();
					}
				});
				threads.Add(t);
			}

			Stopwatch sw = new Stopwatch();
			sw.Start();

			// Start profiling threads
			threads.ForEach(t => t.Start());

			// Wait for all threads to stop
			threads.ForEach(t => t.Join());

			sw.Stop();

			return sw.Elapsed;
		}
	}
}
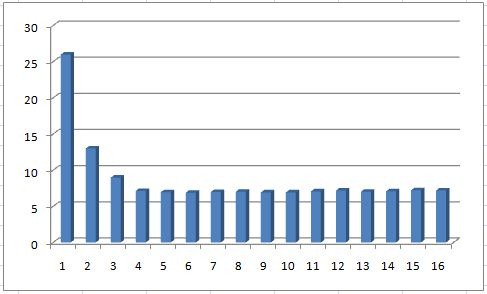
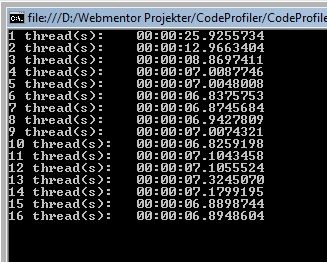
Using the CodeProfiler class, it’s easy for us to do code profiling, including measuring the effects of parallelization. Here’s an example of calculating the square root of the numbers 1 through 10 million 100 times, using 1-16 simultaneous threads. FYI I’m runing on a quad core machine.
using System;

namespace CodeProfiler
{
	class Program
	{
		static void Main(string[] args)
		{
			Action action = () =>
			{
				for (int i = 0; i < 10000000; i++)
					Math.Sqrt(i);
			};

			for(int i=1; i<=16; i++)
				Console.WriteLine(i + " thread(s):t" + CodeProfiler.ProfileAction(action, 100, i));

			Console.Read();
		}
	}
}
And the result as expected, the performance panning out when threads >= cores. Using more threads than there is cores will usually not result in added performance, just increased context switching which is not desirable. Here’s the resulting execution times with seconds on the Y axis and number of threads on the X axis.