Yesterday I did an interview with Søren Spelling Lund for ANUG (Aarhus .NET User Group) on SQL Server Optimization, as a followup to my recent talk on that subject. He asked me an interesting question - what is the normal process of determining the need of an optimization, and how to actually do it? This is a case study from today.
The issue started out by one of the sales people telling me the catalogs were loading slowly. Being a limited number of people in a small office, my usual first resolution is to simply ask if anyone in the office are downloading/uploading files, since that’ll usually exhaust our rather limited network connection. Unfortunately, that was not the reason. Next step - locate the exact location of the issue. I asked which catalogs specifically were loading slowly, and whether it was all of it loading slowly, just the images or anything else that might narrow down the issue.
The response was quite a bit more precise than I’d hoped for:

So it wasn’t a matter of things loading slowly… It was a matter of things not loading at all! Funny thing is, during the ANUG interview, Søren asked me how one could detect when optimizations were needed - part of my answer was “When SqlCommands start timing out”.
Armed with a precise error message and the location of the error, I detected the exact operation that caused the timeout. It’s a simple statistics page, showing the number of page views during the last 7 days - nothing exotic, but yet it failed.
SELECT
    SUM(TDH.SmallViewCount)
FROM
    tblFEStatsDayHits TDH
INNER JOIN
    tblFEStatsDays TD ON TD.DayID = TDH.DayID
WHERE
    TDH.PaperID = 304275 AND
    DATEDIFF(dd, TD.Day, GETDATE()) < 7
The query is rather basic, it tries to sum up the SmallViewCount (containing the number of views of a single page) from the table tblFEStatsDayHits. This table has a reference to the helper table tblFEStatsDays, containing a single row per day. Thus tblFEStatsDays is a very small table which is only used for getting the actual day this event occurred on. We filter on a PaperID (which is basically a specific catalog) as well as on DATEDIFF(dd, TD.Day, GETDATE()) being below 7 - making sure we only consider data for the last 7 days. So given a rather simple query, how can this be so bad?
Take a look at the IO statistics:
Table 'tblFEStatsDayHits'. Scan count 5, logical reads 484959, physical reads 3, read-ahead reads 304063, lob logical reads 0, lob physical reads 0, lob read-ahead reads 0.
Table 'tblFEStatsDays'. Scan count 5, logical reads 10, physical reads 0, read-ahead reads 0, lob logical reads 0, lob physical reads 0, lob read-ahead reads 0.
This confirms that tblFEStatsDays isn’t of interest to us since it only had 10 page reads. tblFEStatsDayHits on the other hand had 484959 page reads. That’s around 3,7 (484959 * 8KB per page) gigs of data being read. Though it’s logical reads (that is, from memory), that’s still an insane amount, especially since they’re most likely physical reads the first time they’re read. The database server is running on a RAID1 15k SAS mirror, giving us at most about 150MB/sec of IO performance - ignoring any other active tasks. That’s about 25 seconds of uninterrupted IO read time - that’s bound to blow up at some point.
Let’s look at the execution plan:
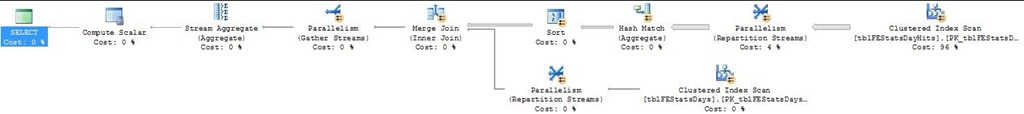
This pretty much confirms the issue lies in the Clustered Index Scan - which is more or less the last operation you want to see in an exceution plan. It represents a complete read of the whole clustered index - an operation that scales rather linearly with the amount of data you have in your tables. So how big is this table?
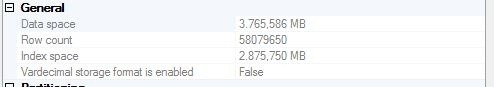
It’s got a bit short of 60M rows, 3,7 gigs of data (matching up to our 3,7 gig read earlier), and an additional ~3 gigs of extra index data. Clearly, if this operation is to be fast, we need to use indexes wisely so we avoid reading all of this data.
If we look at the execution plan in SQL Server Management Studio 2008 (won’t work in SMS2005), it’ll actually give us a recommendation for a specific index that it could’ve used:

CREATE NONCLUSTERED INDEX
    [<Name of Missing Index, sysname,>]
ON
    [dbo].[tblFEStatsDayHits] ([PaperID])
INCLUDE
    ([DayID],[SmallViewCount])
That specific index would allow us to filter on the PaperID while including the DayID and SmallViewCount columns at the leaf level. The PaperID column has a rather high cardinality, so by filtering on that, we’ve already reduced the data amount considerably. SMS predicts adding this index will optimize the query by about 99% - sounds good, let’s try:
CREATE NONCLUSTERED INDEX [NC_PaperID] ON [dbo].[tblFEStatsDayHits]
(
    [PaperID] ASC
)
INCLUDE
(
    [DayID],
    [SmallViewCount]
)
After adding the index and rerunning the query, these are the new IO statistiscs:
Table 'tblFEStatsDayHits'. Scan count 5, logical reads 1770, physical reads 0, read-ahead reads 0, lob logical reads 0, lob physical reads 0, lob read-ahead reads 0.
Table 'tblFEStatsDays'. Scan count 5, logical reads 10, physical reads 0, read-ahead reads 0, lob logical reads 0, lob physical reads 0, lob read-ahead reads 0.
We’re down from 484959 to only 1770 page reads, that’s an optimization of 99,6%, not too shabby. Let’s look at the new execution plan:
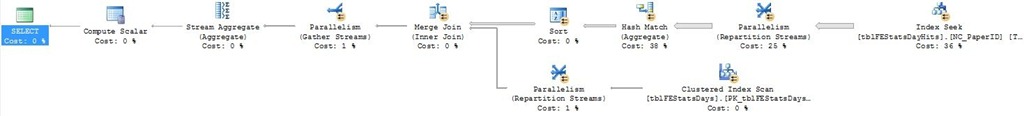
Comparing the two plans reveals that we’ve now replaced that nasty clustered index scan with an index seek - one of the most efficient operations that exist. Now most of the time is spent in the parallelism/hash match operations. These operations make individual sums of the SmallViewCount column for all rows with the same DayID value. It’s running on multiple threads as indicated by the presence of a parallelism operator.
Now, we’re still spending quite a lot of time reading in all of the rows for that specific PaperID and grouping them together by DayID. If a catalog has been having visitors for a year, that’s basically 358 extra days of data we’re reading in for no reason. How about if we change the query to this semantically identical one (given that it’s the 12th of March 2009, 09:52 AM):
SELECT
    SUM(TDH.SmallViewCount)
FROM
    tblFEStatsDayHits TDH
INNER JOIN
    tblFEStatsDays TD ON TD.DayID = TDH.DayID
WHERE
    TDH.PaperID = 304275 AND
    TD.Day > '2009-03-12 09:52:00'
What does this change give us? The “DATEDIFF(dd, TD.Day, GETDATE()) < 7” predicate requires SQL Server to look at each row, performing the DATEDIFF operation to determine whether it should be part of hte final sum aggregate. Doing it this way severely limits the usability of our indexes since we can no longer make an index seek on the Day column. If we from the application instead take the current date and subtract 7 days, that’s basically the cutoff point that we’re interested in. Thus we’ve now changed the predicate to only select columns with a Day value higher than the current date minus 7 days.
Take a look at the resulting execution plan:
It’s dramatically simpler. One important point is that if we look at the index seek on tblFEStatsDayHits, it’s now using the index called NC_DayID_PaperID! This is not the one we made just before, this is another lingering index on the table. Let’s look at it’s definition:
CREATE NONCLUSTERED INDEX [NC_DayID_PaperID] ON [dbo].[tblFEStatsDayHits]
(
    [DayID] ASC,
    [PaperID] ASC
)
Why is it suddenly using this index? To understand, we first have to know what’s actually happening. The whole process has been turned upside down compared to the last plan. In the last plan, we first read in the actual data filtered by PaperID, and then we filtered on the relevant days. Now we’re first finding the relevant DayIDs by joining the tblFEStatsDays table with the NC_DayID_PaperID index, and for each relevant row, we perform a bookmark lookup in the tblFEStatsDayHits table. So why is it not using the NC_PaperID index we made just before? NC_PaperID had a single index column and two included ones (and the implicitly contained clustered key, which is irrelevant as it’s also included in the NC_DayID_PaperID index). Thus, NC_PaperID has three int columns, totalling at 12 bytes of index data per row. The NC_DayID_PaperID only has two keys - PaperID and DayID, totalling at 8 bytes per row. If we add the implicit 4 bytes for the clustered key, thats 16 and 12 bytes per row. With a page size of 8060 bytes of index data, that’s either 503 rows per page or 671 rows per page. That’s about 30% IO saved by using the smaller index. Let’s take a look at the IO statistics for this plan:
Table 'tblFEStatsDayHits'. Scan count 7, logical reads 96712, physical reads 77, read-ahead reads 73, lob logical reads 0, lob physical reads 0, lob read-ahead reads 0.
Table 'tblFEStatsDays'. Scan count 1, logical reads 2, physical reads 0, read-ahead reads 0, lob logical reads 0, lob physical reads 0, lob read-ahead reads 0.
Now what happened here? We went from 1770 page reads to just short of 100K reads! If we hover our mouse on the nested loops step of the query plan, we can see there’s about 23,5K rows being returned:
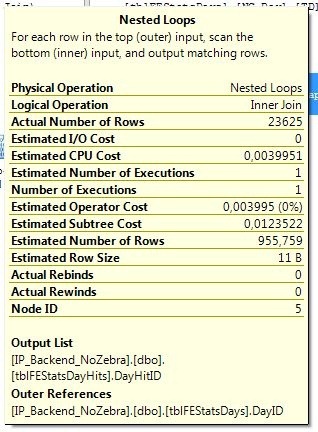
Thus, for each of those 23,5K rows, we have to perform a bookmark lookup in the tblFEStatsDayHits table, that’s about 4 page lookups per resulting row (since the predicate at this point is a DayID, there may be several relevant rows in the tblFEStatsDayHits table, thus the large amount of page reads). The only reason that this is still reasonably fast is that all the pages are already present in memory, so this is a pure CPU operation. But having 100K pages (100000 * 8KB = ~780MB) of data in memory just for this purpose is definitely not optimal! Granted, there’s most likely a lot of reuse in these pages, so the sum may not be 780MB’s (we’d have to count the number of unique pages that were needed for that), but it’s bad nonetheless.
If we hover the mouse on the bookmark lookup operator, we get some extra information:
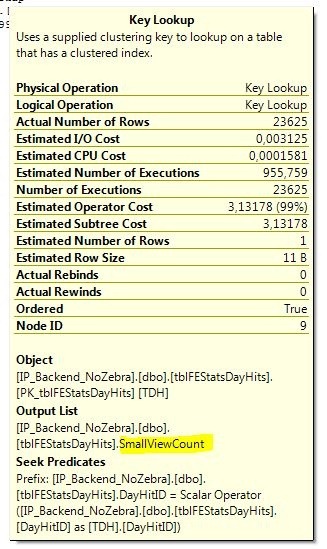
If we look at the output section, we see that the only column that’s actually being returned from these bookmark lookups is the SmallViewCount column. Given that we’re already using the NC_DayID_PaperID index, how about we add the SmallViewCount column as an included column in that index:
CREATE NONCLUSTERED INDEX [NC_DayID_PaperID] ON [dbo].[tblFEStatsDayHits]
(
    [DayID] ASC,
    [PaperID] ASC
)
INCLUDE ([SmallViewCount])
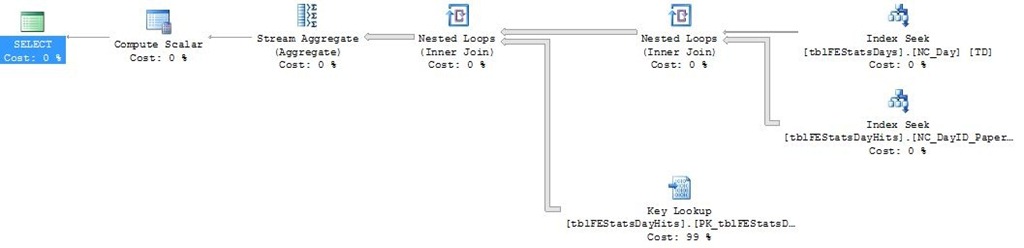
Let’s check the execution plan again:
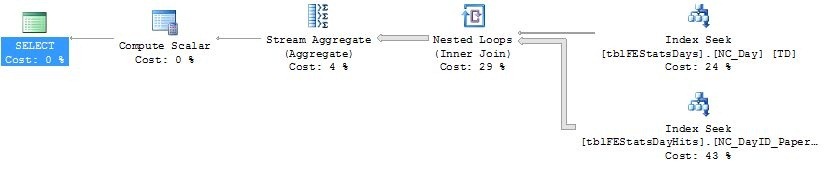
Now we’re starting to get somewhere! Now we’re doing two highly effective index seeks on the tblFEStatsDayHits and tblFEStatsDays tables before we join them together. Let’s take a look at the IO statistics as well:
Table 'tblFEStatsDayHits'. Scan count 7, logical reads 83, physical reads 0, read-ahead reads 0, lob logical reads 0, lob physical reads 0, lob read-ahead reads 0.
Table 'tblFEStatsDays'. Scan count 1, logical reads 2, physical reads 0, read-ahead reads 0, lob logical reads 0, lob physical reads 0, lob read-ahead reads 0.
83 page reads! If we compare that to the original 484959 page reads, that’s an optimization of 99,982%! A query that took upwards of 30 seconds now takes milliseconds. There’s the added reward of having to cache less data in memory (thereby allowing other more important data to stay in memory) and reducing IO load considerably.
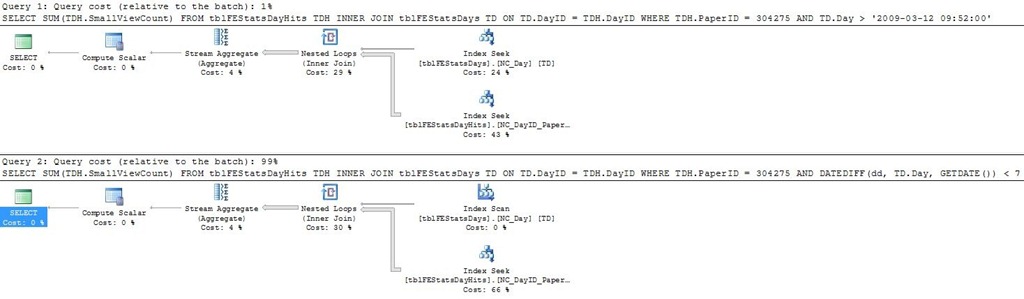
Let’s for the kicks of it try and run the original DATEDIFF() query and see the resulting execution plan:
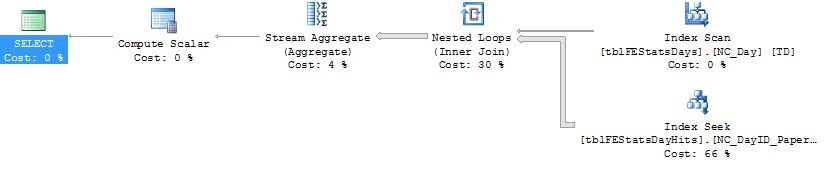
Using the function predicate requires us to scan the whole tblFEStatsDays.NC_Day index, instead of performing a seek. If we run both queries alongside in SMS, we can see a rather large performance advantage of the non-DATEDIFF query (1 : 99 performance ratio):
Conclusion
- Locate the exact cause of the issue before optimizing.
- Do consider SMS’s (and other tools for that sakes) suggestions, but don’t take for granted that it’s the best solution!
- Just because a query plan looks simple, check out the IO statistics to get a better feeling for what actually happens.
- Avoid using functions & other advanced predicates that avoid you from taking advantage of your indexes.
- Watch out for your query changing mind about what indexes to utilize when you make changes to the query.