I’m a big fan of strongly typed database querying as well as returning strong typed results. Due to the nature of static languages, you’ll get compile time checking of all our tables and columns. You can easily rename columns as you can be sure all your (internal) references are accounted for.
Returning strongly typed lists of objects instead of DataReaders/DataTables / any other object based containers will also make it easier to transfer through data layers as you’re always certain of what’s available for you to read and what’s not.
But it comes at a cost. Performance.
I set out to test various different ways we could query our database and generate a strongly typed List with the results in it. I’m using the standard AdventureWorks 2005 database for my testing. For the actual profiling, I’ll be using my CodeProfiler class from a previous blogpost.
I’ll be using two different entities, Product and CompleteProduct:
[Table(Name = "Production.Product")]
public class Product
{
	[Column]
	public virtual int ProductID { get; set; }
	[Column]
	public virtual string Name { get; set; }
	[Column]
	public virtual string ProductNumber { get; set; }
	[Column]
	public virtual bool MakeFlag { get; set; }
	[Column]
	public virtual short SafetyStockLevel { get; set; }
	[Column]
	public virtual decimal ListPrice { get; set; }
	[Column]
	public virtual DateTime SellStartDate { get; set; }
}

[Table(Name = "Production.Product")]
public class CompleteProduct
{
	[Column]
	public int ProductID { get; set; }
	[Column]
	public string Name { get; set; }
	[Column]
	public string ProductNumber { get; set; }
	[Column]
	public bool MakeFlag { get; set; }
	[Column]
	public bool FinishedGoodsFlag { get; set; }
	[Column]
	public string Color { get; set; }
	[Column]
	public short SafetyStockLevel { get; set; }
	[Column]
	public short ReorderPoint { get; set; }
	[Column]
	public decimal StandardCost { get; set; }
	[Column]
	public decimal ListPrice { get; set; }
	[Column]
	public string Size { get; set; }
	[Column]
	public string SizeUnitMeasureCode { get; set; }
	[Column]
	public string WeightUnitMeasureCode { get; set; }
	[Column]
	public decimal? Weight { get; set; }
	[Column]
	public int DaysToManufacture { get; set; }
	[Column]
	public string ProductLine { get; set; }
	[Column]
	public string Class { get; set; }
	[Column]
	public string Style { get; set; }
	[Column]
	public int? ProductSubcategoryID { get; set; }
	[Column]
	public int? ProductModelID { get; set; }
	[Column]
	public DateTime SellStartDate { get; set; }
	[Column]
	public DateTime? SellEndDate { get; set; }
	[Column]
	public DateTime? DiscontinuedDate { get; set; }
	[Column]
	public Guid rowguid { get; set; }
	[Column]
	public DateTime ModifiedDate { get; set; }
}
They both map to the same table, Production.Product. CompleteProduct covers all columns, Product just covers the ones I’m interested in.
Method #1 - Manually mapping from DataReader
private static void performDataReader()
{
	var result = new List<Product>();

	using (SqlConnection conn = new SqlConnection(CONNECTION_STRING))
	{
		using (SqlCommand cmd = conn.CreateCommand())
		{
			cmd.CommandText = COMMAND_TEXT;

			conn.Open();
			using (SqlDataReader sqldr = cmd.ExecuteReader())
			{
				while (sqldr.Read())
				{
					Product p = new Product();
					p.ProductID = Convert.ToInt32(sqldr["ProductID"]);
					p.Name = sqldr["Name"].ToString();
					p.ProductNumber = sqldr["ProductNumber"].ToString();
					p.MakeFlag = Convert.ToBoolean(sqldr["MakeFlag"]);
					p.SafetyStockLevel = Convert.ToInt16(sqldr["SafetyStockLevel"]);
					p.ListPrice = Convert.ToDecimal(sqldr["ListPrice"]);
					p.SellStartDate = Convert.ToDateTime(sqldr["SellStartDate"]);

					result.Add(p);
				}
			}
		}
	}
}
Pros: Fast
Cons: Has to be written for each object model
Method #2 - Manully mapping from DataTable
private static DataTable getDT()
{
	DataTable result = new DataTable();

	using (SqlConnection conn = new SqlConnection(CONNECTION_STRING))
	{
		using (SqlCommand cmd = conn.CreateCommand())
		{
			cmd.CommandText = COMMAND_TEXT;

			using (SqlDataAdapter sqlda = new SqlDataAdapter(cmd))
				sqlda.Fill(result);
		}
	}

	return result;
}

private static void performDataTable()
{
	var result = new List<Product>();

	foreach (DataRow dr in getDT().Rows)
	{
		Product p = new Product();
		p.ProductID = Convert.ToInt32(dr["ProductID"]);
		p.Name = dr["Name"].ToString();
		p.ProductNumber = dr["ProductNumber"].ToString();
		p.MakeFlag = Convert.ToBoolean(dr["MakeFlag"]);
		p.SafetyStockLevel = Convert.ToInt16(dr["SafetyStockLevel"]);
		p.ListPrice = Convert.ToDecimal(dr["ListPrice"]);
		p.SellStartDate = Convert.ToDateTime(dr["SellStartDate"]);

		result.Add(p);
	}
}
Pros: Pretty fast, easy row access, disconnected from database
Cons: Has to be written for each object model
Comment: I often use a getDT()’ish way of accessing my tables. It’s easier than using DataReaders as they’re disconnected, you can traverse them back and forth multiple times.
Method #3 - Automatic mapping using DataContext.Translate
private static void performEntityQuery()
{
	List<Product> result;

	using (SqlConnection conn = new SqlConnection(CONNECTION_STRING))
	{
		using (DataContext dc = new DataContext(conn))
		{
			using (SqlCommand cmd = conn.CreateCommand())
			{
				cmd.CommandText = COMMAND_TEXT;

				conn.Open();
				using(SqlDataReader sqldr = cmd.ExecuteReader())
				{
					result = dc.Translate<Product>(sqldr).ToList();
				}
			}
		}
	}
}
Pros: Works for all object models, easy to use
Cons: Slow
Method #4 - Linq to SQL query for complete entity
private static void performLinqQuery()
{
	List<Product> result;

	using(DataContext dc = new DataContext(CONNECTION_STRING))
	{
		result = dc.GetTable<Product>().OrderBy(p => p.ProductID).Take(rowcount).ToList();
	}
}
Pros: Could it be easier? Works for all object models
Cons: Slow
Method #5 - Linq to SQL query for partial entity
private static void performSubsetLinqQuery()
{
	List<Product> result;

	using (DataContext dc = new DataContext(CONNECTION_STRING))
	{
		result = dc.GetTable<CompleteProduct>().OrderBy(p => p.ProductID).Take(rowcount).Select(p => new Product() {
			ListPrice = p.ListPrice,
			ProductID = p.ProductID,
			MakeFlag = p.MakeFlag,
			Name = p.Name,
			ProductNumber = p.ProductNumber,
			SafetyStockLevel = p.SafetyStockLevel,
			SellStartDate = p.SellStartDate }).ToList();
	}
}
Pros: Easy, works for all object models
Cons: Slow
Comments: In the previous method I retrieved complete Product entities. This time I’m retrieving only some columns of the CompleteProduct entity, mapping them over into a new Product. I’ve included this to see if there’s any performance difference in comparison to loading complete entities.
Method #6 - Automatically mapping from DataReader
private static List<T> mapList<T>(SqlDataReader dr)
{
	List<T> list = new List<T>();

	PropertyInfo[] properties = typeof(T).GetProperties();
	T t = Activator.CreateInstance<T>();

	while(dr.Read())
	{
		foreach (PropertyInfo pi in properties)
			pi.SetValue(t, dr[pi.Name], null);

		list.Add(t);
	}

	return list;
}

private static void performAutomappedDataReader()
{
	List<Product> result;

	using (SqlConnection conn = new SqlConnection(CONNECTION_STRING))
	{
		using (SqlCommand cmd = conn.CreateCommand())
		{
			cmd.CommandText = COMMAND_TEXT;

			conn.Open();
			using (SqlDataReader sqldr = cmd.ExecuteReader())
			{
				result = mapList<Product>(sqldr);
			}
		}
	}
}
Pros: Simple to use, works for all object models
Cons: Slow, reflection based
Method #7 - Enhanced automatic mapping from DataReader
private static void performEnhancedAutomappedDataReader()
{
	List<Product> result;

	using (SqlConnection conn = new SqlConnection(CONNECTION_STRING))
	{
		using (SqlCommand cmd = conn.CreateCommand())
		{
			cmd.CommandText = COMMAND_TEXT;

			conn.Open();
			using (SqlDataReader sqldr = cmd.ExecuteReader())
			{
				result = EntityMapper.MapToEntities<Product>(sqldr).ToList();
			}
		}
	}
}
Pros: ???
Cons: ???
Comments: This is an enhanced version of the previous method that I’ve made. Explaining the inner workings is outside the scope of this particular topic so I’ll have to explain it in my next post. For now, just imagine something very cool and sexy. UPDATE: you can read about the method here.
Method #8 - SubSonic SqlQuery
private static void performSubSonicQuery()
{
	List<Product> result =
		new Select
			(
				Subsonic.Product.ProductIDColumn.QualifiedName,
				Subsonic.Product.NameColumn.QualifiedName,
				Subsonic.Product.ProductNumberColumn.QualifiedName,
				Subsonic.Product.MakeFlagColumn.QualifiedName,
				Subsonic.Product.SafetyStockLevelColumn.QualifiedName,
				Subsonic.Product.ListPriceColumn.QualifiedName,
				Subsonic.Product.SellStartDateColumn.QualifiedName
			)
			.Top(rowcount.ToString())
			.From(Subsonic.Product.Schema)
			.OrderAsc(Subsonic.Product.ProductIDColumn.QualifiedName)
			.ExecuteTypedList<Product>();
}
Pros: Works for all object models
Cons: Slow
Comments: I’ve never used SubSonic before, so I may have overlooked some obvious performance enhancements, thus, take my numbers with a grain of salt.
Method #9 - NHibernate CreateCriteria
private static Configuration nhCfg;
private static ISessionFactory nhFactory;

private static void performNHibernateQuery()
{
	List<Product> result;

	using (ISession session = nhFactory.OpenSession())
	{
		result = (List<Product>)session.CreateCriteria(typeof(Product)).AddOrder(Order.Asc("ProductID")).SetMaxResults(rowcount).List<Product>();
	}
}
Pros: Easy, works for all object models, concise querying
Cons: Slow
Comments: I’ve never used NHibernate before, so I may have overlooked some obvious performance enhancements, thus, take my numbers with a grain of salt.
Method #10 - Compiled LinqQuery
private static Func<DataContext, int, IEnumerable<Product>> compiledQuery;
private static void performCompiledLinqQuery()
{
	List<Product> result;

	using (DataContext dc = new DataContext(CONNECTION_STRING))
	{
		result = compiledQuery(dc, rowcount).ToList();
	}
}
Pros: Among the fastest, no matter the rowcount, works for all object models
Cons: Requires a bit more setting up and helper functionality to store the compiled queries
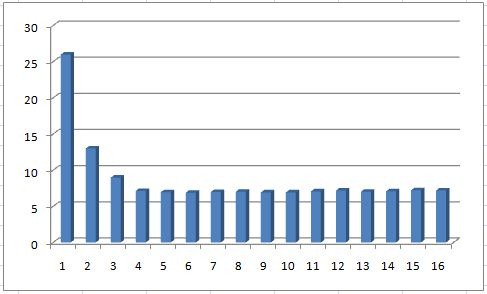
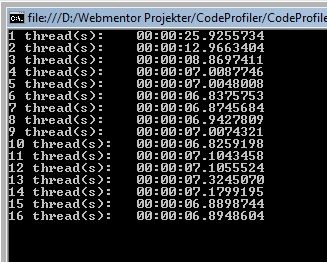
The profiling
I profiled each of the test cases by returning 1, 10, 100, 1.000, 10.000 and 100.000 rows. The numbers are the total execution time of 50 iterations of each method. I’m on a quad core machine so I set the max parallelization degree to three, thus saving myself a core for running SQL Server and Windows.
static void Main(string[] args)
{
	// Make sure we don't get disturbed by other processes
	Process.GetCurrentProcess().PriorityClass = ProcessPriorityClass.High;

	// We'll let NHibernate cache it's Configuration and SessionFactory as we'd probably do this in most live applications
	nhCfg = new Configuration();
	nhCfg.AddAssembly(Assembly.GetExecutingAssembly());
	nhFactory = nhCfg.BuildSessionFactory();

	foreach(int rc in new int[] { 1, 10, 100, 1000, 10000, 100000 })//, 100, 1000, 10000, 100000 })
	{
		Console.WriteLine("Rowcount: " + rc);
		rowcount = rc;

		// Set the rowcount
		COMMAND_TEXT = ORIGINAL_COMMAND_TEXT.Replace("{rowcount}", rowcount.ToString());

		// Make sure the enhanced automapped datareader does not use cached resources from previous run
		EntityMapper.ClearCachedMapperMethods();

		// Compile the query for the compiled linq query test
		compiledQuery = CompiledQuery.Compile<DataContext, int, IEnumerable<Product>>((DataContext dc, int takeCount) => dc.GetTable<Product>().OrderBy(p => p.ProductID).Take(takeCount));

		Console.WriteLine("performDataReader: " + CodeProfiler.ProfileAction(performDataReader, iterations, 3));
		Console.WriteLine("performDataTable: " + CodeProfiler.ProfileAction(performDataTable, iterations, 3));
		Console.WriteLine("performEntityQuery: " + CodeProfiler.ProfileAction(performEntityQuery, iterations, 3));
		Console.WriteLine("performLinqQuery: " + CodeProfiler.ProfileAction(performLinqQuery, iterations, 3));
		Console.WriteLine("performCompiledLinqQuery: " + CodeProfiler.ProfileAction(performCompiledLinqQuery, iterations, 3));
		Console.WriteLine("performSubsetLinqQuery: " + CodeProfiler.ProfileAction(performSubsetLinqQuery, iterations, 3));
		Console.WriteLine("performAutomappedDataReader: " + CodeProfiler.ProfileAction(performAutomappedDataReader, iterations, 3));
		Console.WriteLine("performEnhancedAutomappedDataReader: " + CodeProfiler.ProfileAction(performEnhancedAutomappedDataReader, iterations, 3));
		Console.WriteLine("performSubSonicQuery: " + CodeProfiler.ProfileAction(performSubSonicQuery, iterations, 3));
		Console.WriteLine("performNHibernateQuery: " + CodeProfiler.ProfileAction(performNHibernateQuery, iterations, 3));
	}

	Console.Write("Done");
	Console.Read();
}
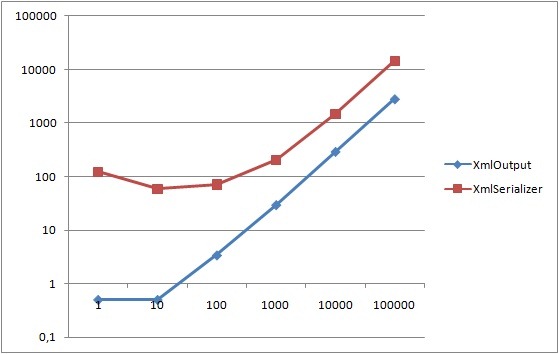
The results
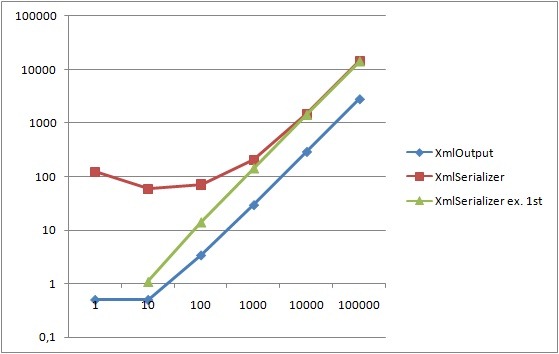
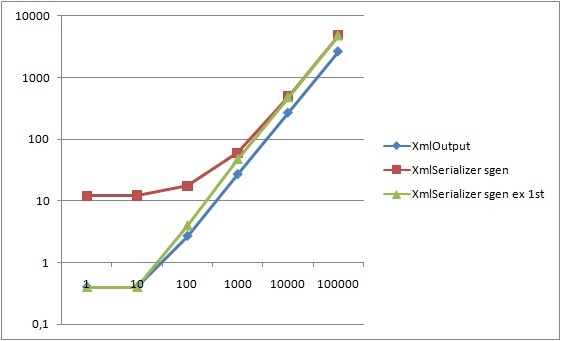
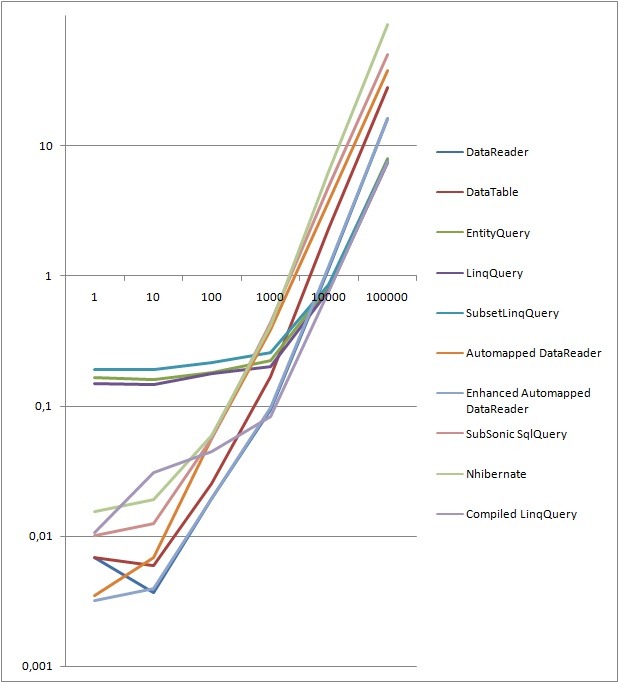
The following two graphs shows the total runtime of 50 iterations for each different method, as well as the total runtime divided by number of rows. Runtime in seconds along the Y-axis, number of rows along the X-axis. It basically shows that all LINQ to SQL flavors suffer from initial setup, but they scale extremely well, ending up outperforming all other contestants by a fair margin. One could argue that it’s rarely relevant in cases of more than a thousand rows as we’ll rarely pull out that much data at once. Never the less, I find it interesting - it’s something I’ll have to look under the hood to find an explanation of. Ignoring some variance due to the low row number, DataReader, DataTable and my Enhanced Automapped DataReader functions outperform most contestants.
UPDATE:
It seems the reason the LINQ flavors are so speedy is because their object mapper methods are being cached in the local thread cache. And since the CodeProfiler will execute all iterations on the same thread, each iteration (except the first) will simply reuse the mapper methods. See System.Data.Linq.SqlClient.ObjectReaderCompiler.Compile() for reference.
UPDATE 2:
As Kris Vandermotten duly commented, I should have tested a compiled LINQ query as well as that really is a separate scenario. I’ve added a tenth method as well as a new line in the graphs. The compiled LINQ query, although requiring a bit more plumbing code, really blows the competition away. It’s fast for even single row queries since we no longer suffer from the compilation time. For larger rowsets the advantage diminishes as the saved compilation time is spread out over a large amount of rows.
UPDATE 3:
As a friend of mine, Jakob Andersen points out, I really should be a bit more specific in regards to the purpose of these comparisons.
I am in no way trying to make the claim that it’s unreasonable that an OR/M framework hurts performance. Neither am I claiming that my comparisons between LINQ to SQL, Subsonic and nHibernate are fair. Really, to make a fair comparison, one should compare the very specific features of the frameworks, not a feature set as general as what I’m doing in these tests.
The thing is, some of these frameworks (nHibernate, I’m looking at you especially) just offer so much more functionality that it’s a burden they have to live with. While this extra functionality might cost a bit when we’re just trying to test the actual object translation performance, it might gain you a whole lot more in real life scenarios. Take for instance, if you utilize nHibernates caching, you might save the time that goes towards the database lookups - saving you much more than the actual translation process in most cases.
So, as mentioned in a couple of tests - take these results with a grain of salt. They’re rather out-of-the-box simple tests of direct querying & result translation performance. We’re ignoring all of the extra OR/M features that we have available, and we’re ignoring that these different frameworks offer very different functionality.
Total runtime
Runtime per row
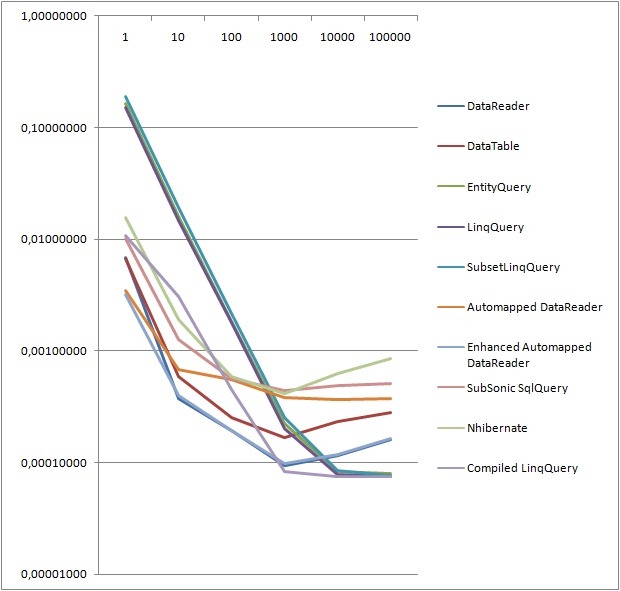
Remember, even though there seems to be somewhat of a speed difference, the fastest method takes only 0,000074 seconds, while the slowest takes 0,00085 seconds. No matter what, you should’nt consider refactoring your solutions in regards to performance unless you really have a high hit count, or unless it’s for valid architectural reasons. Otherwise you might just risk having Ted Dziuba shove his foot up your ass.
Downloads
PerformanceComparison_ReadingStronglyTyped.zip - Sample code
Reading_Data_From_Database_Profiling.xslx - Profiling results