This is the story of how a simple oversight resulted in a tough to catch bug. As is often the case, it worked on my machine and only manifested itself in production on a live site. In this series we will look at analyzing 100% CPU usage using Windbg.
The Symptom
Some HTTP requests were being rejected by one of our servers with status 503 indicating that the request queue limit had been reached. Looking at the CPU usage, it was clear why this was happening.
Initially I fixed the issue by issuing an iisreset, clearing the queue and getting back to normal. But when this started occurring on multiple servers at random times, I knew there was something odd going on.
Isolating the Server and Creating a Dump
To analyze what’s happening, I needed to debug the process on the server while it was going on. So I sat around and waited for the next server to act up, and sure enough, within a couple of hours another one of our servers seemed to be stuck at 100% CPU. Immediately I pulled it out of our load balancers so it wasn’t being served any new requests, allowing me to do my work without causing trouble for the end users.
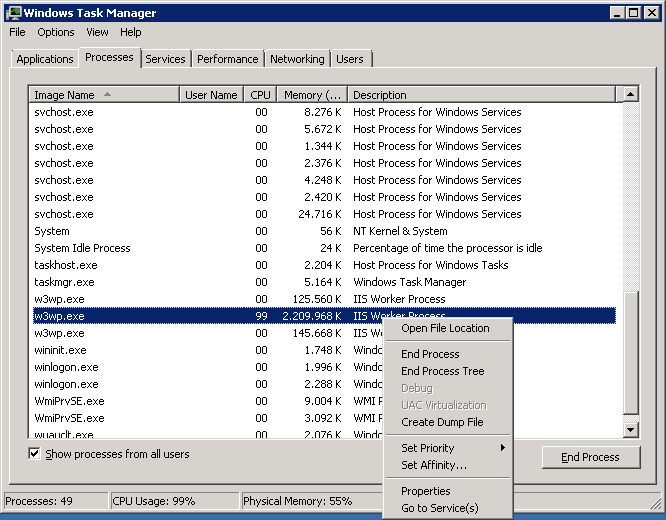
In server 2008 it’s quite easy to create a dump file. Simply fire up the task manager, right click the process and choose “Create Dump File”.
Do note that task manager comes in both an x64 and an x86 version. If you run the x64 version and make a dump of an x86 process, it’ll still create an x64 dump, making it unusable. As such, make sure you use whatever task manager that matches the architecture of the process you want to dump. On an x64 machine (with Windows on the C: drive) you can find the x86 task manager here: C:\Windows\SysWOW64\taskmgr.exe. Note that you can’t run both at the same time, so make sure to close the x64 taskmgr.exe process before starting the x86 one.
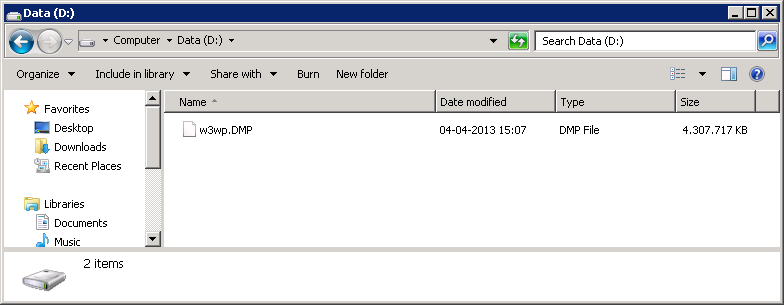
Once the dump has been created, a message will tell you the location of the .DMP file. This is roughly twice the size of the process at the time of the dump, so make sure you have enough space on your C: drive.
Finding the Root Cause Using Windbg
Now that we have the dump, we can open it up in Windbg and look around. You’ll need to have Windbg installed in the correct version (it comes in both x86 and x64 versions). While Windbg can only officially be installed as part of the whole Windows SDK, Windbg itself is xcopy deploy-able, and is available for download here.
To make things simple, I just run Windbg on the server itself. That way I won’t run into issues with differing CLR versions being installed on the machine, making debugging quite difficult.
Once Windbg is running, press Ctrl+D and open the .DMP file.
The first command you’ll want to execute is this:
!loadby sos clr
This loads in the Son of Strike extension that contains a lot of useful methods for debugging .NET code.
Identifying Runaway Threads
As we seem to have a runaway code issue, let’s start out by issuing the following command:
!runaway
This lists all the threads as well as the time spent executing user mode code. When dealing with a 100% CPU issue, you’ll generally see some threads chugging away all the time. In this case it’s easy to see that looking at just the top four threads, we’ve already spent over 20 (effective) minutes executing user mode code - these threads would probably be worth investigating.
Analyzing CLR Stacks
Now that we’ve identified some of the most interesting threads, we can select them one by one like so:
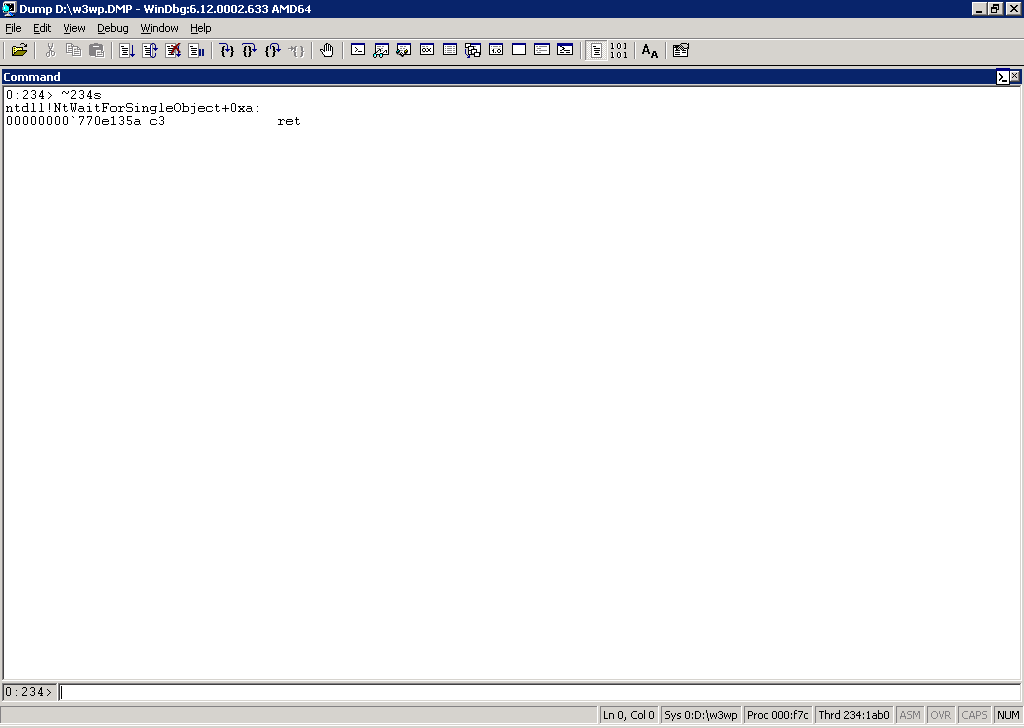
~Xs
Switching X out with a thread number (e.g. 234, 232, 238, 259, 328, etc.) allows us to select the thread. Notice how the lower left corner indicates the currently selected thread:
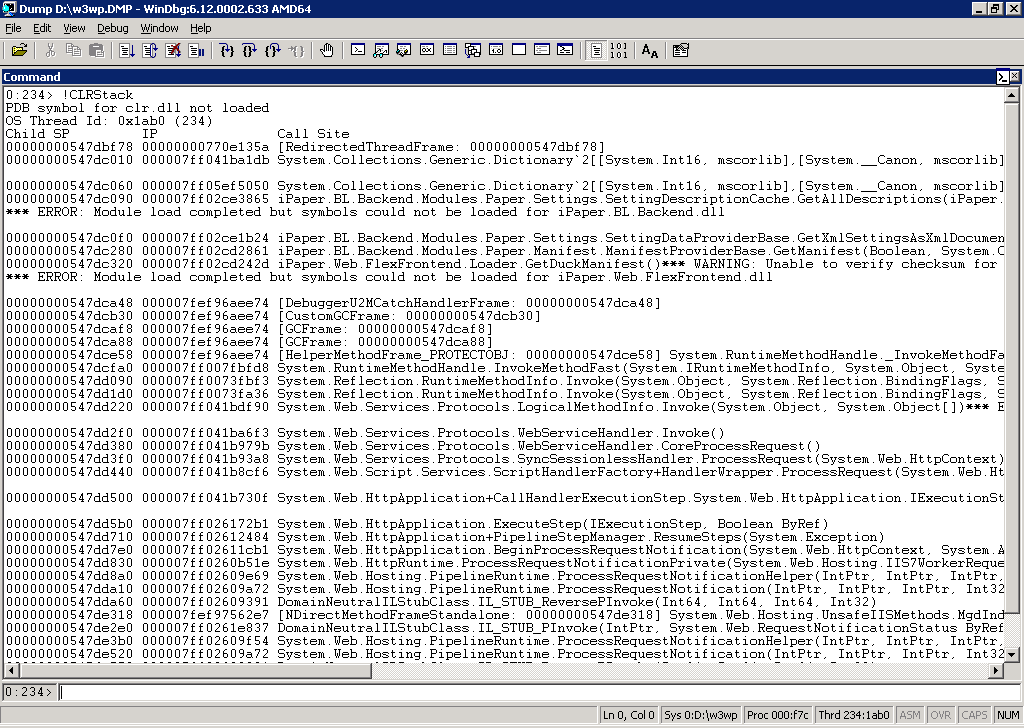
Once selected, we can see what the thread is currently doing by executing the following command:
!CLRStack
Looking at the top frame in the call stack, it seems the thread is stuck in the BCL Dictionary.FindEntry() method:
System.Collections.Generic.Dictionary`2[[System.Int16, mscorlib],[System.__Canon, mscorlib]].FindEntry(Int16)
Tracing back just a few more frames, this seems to be invoked from the following user function:
iPaper.BL.Backend.Modules.Paper.Settings.SettingDescriptionCache.GetAllDescriptions()
Performing the same act for the top five threads yields a rather clear unanimous picture:
234:
System.Collections.Generic.Dictionary`2[[System.Int16, mscorlib],[System.__Canon, mscorlib]].FindEntry(Int16)
...
iPaper.BL.Backend.Modules.Paper.Settings.SettingDescriptionCache.GetAllDescriptions(iPaper.BL.Backend.Infrastructure.PartnerConfiguration.IPartnerConfig)

232:
System.Collections.Generic.Dictionary`2[[System.Int16, mscorlib],[System.__Canon, mscorlib]].Insert(Int16, System.__Canon, Boolean)
...
iPaper.BL.Backend.Modules.Paper.Settings.SettingDescriptionCache.init(iPaper.BL.Backend.Infrastructure.PartnerConfiguration.IPartnerConfig)

238:
System.Collections.Generic.Dictionary`2[[System.Int16, mscorlib],[System.__Canon, mscorlib]].FindEntry(Int16)
...
iPaper.BL.Backend.Modules.Paper.Settings.SettingDescriptionCache.GetAllDescriptions(iPaper.BL.Backend.Infrastructure.PartnerConfiguration.IPartnerConfig)

259:
System.Collections.Generic.Dictionary`2[[System.Int16, mscorlib],[System.__Canon, mscorlib]].FindEntry(Int16)
...
iPaper.BL.Backend.Modules.Paper.Settings.SettingDescriptionCache.GetAllDescriptions(iPaper.BL.Backend.Infrastructure.PartnerConfiguration.IPartnerConfig)

328:
System.Collections.Generic.Dictionary`2[[System.Int16, mscorlib],[System.__Canon, mscorlib]].FindEntry(Int16)
...
iPaper.BL.Backend.Modules.Paper.Settings.SettingDescriptionCache.GetAllDescriptionsAsDictionary(iPaper.BL.Backend.Infrastructure.PartnerConfiguration.IPartnerConfig)
Interestingly, all of the threads are stuck inside internal methods in the base class library Dictionary class. All of them are invoked from the user SettingDescriptionCache class, though from different methods.
Stay tuned for part 2 where we’ll dive into the user code and determine what’s happening!


