Over the last years I’ve been doing less and less coding while doing more and more management. As of today I’m taking it a step further as I’m assuming the role of CEO at iPaper A/S.
While this does mean less coding at work, I won’t be going full manager. I’ll still be reverse engineering databases in my spare time, I’ll still be debugging interesting problems, just as I’ll still continue contributing to open source.
Me, Myself & SQL Server
Though I won’t be giving up coding, this will have an impact on the amount of time I can spend on extracurricular activies, such as presenting. Unfortunately this also means I won’t be able to participate in neither the MVP nor the SQL PASS summits this year. I had really looked forward to joining the MVP summit for the first time, but unfortunately I will have to prioritize time differently for now.
This is not a goodbye to the family, simply an explanation for why I won’t be seeing you this November.
While visiting Russia will be a first-time experience for me, the topic I’m presenting on is not. In just 30 minutes I will try to give an overview of not only how SQL Server stores data internally, but also how it keeps track of that data.
Full Abstract
Understanding SQL Server Data Files at the Byte Level
Think SQL Server is magical? You’re right! However, there’s some sense to the magic, and that’s what I’ll show you in this level 500 deep dive session. I will walk you through the internal storage format of MDF files, how we might go about parsing a complete database ourselves, using nothing but a hex editor. I will cover how SQL Server stores its own internal metadata about objects, how it knows where to find your data on disk, and once it finds it, how to read it.
A permalink ought to live for the duration of your content, and most importantly, never change. However, having been through a number of different blog engines, not all of them support the same permalink structures, and might not even support redirecting old ones. As such, throgh the years my posts have ended up with multiple permalinks:
As you can see, I’ve dropped both the /archive/ and the /blog/ prefixes, as well as the dates. Redirecting old incoming links to the new ones was easy enough when I ran Wordpress on Apache. All it requires were a couple of lines in the .htaccess file:
Since I’ve migrated to Hexo it’s not as simple, unfortunately. I no longer host my site on Apache, but on GitHub Pages. GitHub Pages only allow static files to be served, so I’m no longer able to utilize the .htaccess rewriting rules. There’s also no server-side functionality available, so I can’t even manually send out a 302-redirect, needed to preserve my incoming links SEO value.
What I ended up doing was to write a small script that would parse my Wordpress backup file and then recreate the /blog/ and /archive/ directories, as if the posts were actually stored there:
string template = @"layout: false
---
<!DOCTYPE html>
<html>
<head>
<title>Redirecting to [Title]</title>
<link rel=""canonical"" href=""[Permalink]""/>
<meta http-equiv=""content-type"" content=""text/html; charset=utf-8"" />
<meta http-equiv=""refresh"" content=""0;url=[Permalink]"" />
</head>
<body>
Redirecting to <a href=""[Permalink]"">[Title]</a>...
</body>
</html>";
void Main()
{
var outputPath = @"D:\Projects\improve.dk (GIT)\source\";
var xmlPath = @"D:\Projects\improve.dk (GIT)\marksrasmussen-blog.wordpress.2014-03-08.xml";
var xml = File.ReadAllText(xmlPath);
var xd = new XmlDocument();
xd.LoadXml(xml);
var nsmgr = new XmlNamespaceManager(xd.NameTable);
nsmgr.AddNamespace("content", "http://purl.org/rss/1.0/modules/content/");
nsmgr.AddNamespace("wp", "http://wordpress.org/export/1.2/");
foreach (XmlNode item in xd.SelectNodes("//item"))
{
var title = item.SelectSingleNode("title").InnerText;
var date = Convert.ToDateTime(item.SelectSingleNode("pubDate").InnerText);
var slug = item.SelectSingleNode("wp:post_name", nsmgr).InnerText;
var indexHtml = template
.Replace("[Permalink]", "http://improve.dk/" + slug + "/")
.Replace("[Title]", HttpUtility.HtmlEncode(title));
// First create the /archive/ entryvar outputFolder = Path.Combine(outputPath, "archive", date.Year.ToString(), date.Month.ToString().PadLeft(2, '0'), date.Day.ToString().PadLeft(2, '0'), slug + ".aspx");
var indexPath = Path.Combine(outputFolder, "index.html");
Directory.CreateDirectory(outputFolder);
File.WriteAllText(indexPath, indexHtml);
// Then the /blog/ entry
outputFolder = Path.Combine(outputPath, "blog", date.Year.ToString(), date.Month.ToString().PadLeft(2, '0'), date.Day.ToString().PadLeft(2, '0'), slug);
indexPath = Path.Combine(outputFolder, "index.html");
Directory.CreateDirectory(outputFolder);
File.WriteAllText(indexPath, indexHtml);
}
}
Now the post stored directly in the root, while placeholders have been put in place in the old /blog/ and /archive/ directories. The placeholder code is very simple:
layout: false
---
<!DOCTYPE html><html><head><title>Redirecting to TxF presentation materials</title><linkrel="canonical"href="http://improve.dk/txf-presentation-materials/"/><metahttp-equiv="content-type"content="text/html; charset=utf-8" /><metahttp-equiv="refresh"content="0;url=http://improve.dk/txf-presentation-materials/" /></head><body>
Redirecting to <ahref="http://improve.dk/txf-presentation-materials/">TxF presentation materials</a>...
</body></html>
It’s simply a small script that contains a meta refresh tag that sends the user on to the new URL. By utilizing the ´rel=”canonical”` meta tag, I ensure that this retains the SEO value as if I had performed a 302 redirect.
Going Forward
Creating the placeholder files is a one-off task, seeing as I’ll only ever need to redirect posts that precede the time when I changed my URL structure to contain neither the /blog/ and /archive/ prefixes, nor the dates. All posts from the beginning of 2013 were published using the current URL scheme, which I intend to keep for the foreseeable future.
It’s this time of the year again - the time to migrate from one blog engine to another.
About a year ago, I migrated from Subtext to Wordpress. While I was initially happy, I still wasn’t completely satisfied with the workflow. My primary peeves were:
Complexity - I had to pay a host to run a stack consisting of PHP and MySQL and keep it updated.
Security - I needed to constantly keep watch over Wordpress and keep it updated, seeing as it’s a popular target for mass defacements, etc.
Backups - While I did run an automated backup plugin, it was cumbersome as I needed an offsite location (i used FTP).
Writing - While the WYSIWYG editor works for some, it didn’t for me. As such I ended up writing all my posts in pure HTML.
Openness - I’m a big proponent of open source and while I did publish the source code for my custom Wordpress theme, I wanted to also open up my blog posts themselves.
Speed - I’ve spent more time than I’d like to, just keeping Wordpress running smoothly. A lot of things were outside of my control though, seeing as performance optimization was typically relegated to third party plugins.
While considering the above list, I ended up settling on Hexo - a static site generator powered by Node.js.
Migration
The migration process was simple enough, though it required some manual labor. All my Wordpress posts are written in HTML and since Hexo posts are based on Markdown, they needed to be converted. After dumping my old Wordpress site into a backup XML file, I was able to write a script that parsed the backup XML file and converted each post into the Hexo Markdown format. There were some misses that required manual intervention, seeing as I had invalid HTML, special cases, etc. But overall, 95% of the posts were converted automatically.
Since Hexo is a static site generator, I needed to host my comments offsite. Thankfully Disqus has native support for the Wordpress comment backup format so importing the comments was a breeze.
Hexo does not support storing assets and posts in folders but prefers to store posts and assets seperately. As I like to keep them together (seeing as I’ve got close to 300 posts), I had to write a small script that copied the assets into the right output locations:
var fs = require('fs');
var path = require('path');
var publicDir = hexo.public_dir;
var sourceDir = hexo.source_dir;
var postsDir = path.join(sourceDir, '_posts');
var htmlTag = hexo.util.html_tag;
var route = hexo.route;
// Stores assets that'll need to be copied to the post output foldersvar filesToCopy = [];
// After Hexo's done generating, we'll copy post assets to their public folderse
hexo.on('generateAfter', function() {
filesToCopy.forEach(function(obj) {
fs.writeFileSync(obj.destination, fs.readFileSync(obj.source));
});
});
// Each time a post is rendered, note that we need to copy its assets
hexo.extend.filter.register('post', function(data, cb) {if (data.slug) {
var postDir = path.join(postsDir, data.slug);
var files = fs.readdirSync(postDir);
files.forEach(function(file) {// Skip the markdown files themselvesif (path.extname(file) == '.md')
return;
var outputDir = path.join(publicDir, data.slug);
var outputPath = path.join(publicDir, data.slug, file);
var inputPath = path.join(postDir, file);
if (!fs.existsSync(outputDir))
fs.mkdirSync(path.join(outputDir));
filesToCopy.push({ source: inputPath, destination: outputPath });
});
}
cb();
});
Though Hexo has a number of helpers to easily insert image links, I prefer to be able to just write an image name on a line by itself and then have the asset link inserted. Enabling that was easy enough too:
// Replaces lines with image names with the actual image markup
hexo.extend.filter.register('pre', function(data, cb) {// Find all matching image tagsvar regex = newRegExp(/^([a-z_0-9\-\.]+(?:.jpg|png|gif))(?: ([a-z]+)( \d+)?)?$/gim);
data.content = data.content.replace(regex, function(match, file, type, maxHeight) {// Create image linkvar imgLink;
if (data.slug) // Posts need to reference image absolutely
imgLink = '/' + data.slug + '/' + file;
else
imgLink = file;
// Max height of imagevar imgMaxHeight = '250px';
if (maxHeight)
imgMaxHeight = maxHeight + 'px';
// Set style depending on typevar style = '';
if (type) {
switch (type) {
case'right':
style = 'float: right; margin: 20px';
break;
case'left':
style = 'float: left';
break;
}
}
return'<div class="imgwrapper" style="' + style + '"><div><a href="' + imgLink + '" class="fancy"><img src="' + imgLink + '" style="max-height: ' + imgMaxHeight + '"/></a></div></div>';
});
// Let hexo continue
cb();
});
Hosting, Security, Backup & Speed
Due to its static nature, there are no logins to protect, per se - seeing as there’s no backend. The blog itself is hosted on Github, both the source as well as the statically generated output files. This means I’ve got full backup in the form of distributed git repositories, as well as very easy rollback in case of mistakes.
As for speed, it doesn’t get much faster than serving static files. Comments are lazily loaded after the post itself is loaded. While I can’t utilize the Github CDN (seeing as I’m hosting the blog at an apex domain, making it impossible for me to setup a CNAME - which is required to use the Github CDN), the speed is way faster than it used to be on Wordpress. I could move my DNS to a registrar that supports apex aliasing, but I’m happy with the speed for now.
Openness
Finally, since the source for the blog itself is hosted on Github, including the posts themselves, each post is actually editable directly on Github. You’ll notice that I’ve added an Octocat link at the bottom of each post, next to the social sharing icons. Clicking the Octocat will lead you directly to the source of the post you’re looking at. If you find an error or have a suggestion for an edit, feel free to fork the post and submit a pull request.
I’m happy to announce that I’ll be presenting at SQLSaturday #275 in Copenhagen on March 29th!
I’ll be presenting my Recovering Data from Fatally Corrupt Databases session:
Imagine the worst case scenario: Your database won’t come online. Lots of checksum errors logged. DBCC CheckDB won’t even run on the database. And worst of all - you have no backups! Now what do you do with this 20GB binary blob of an MDF file? In this demo-rich session I will briefly introduce the internals of MDF files while primarly concentrating on how to manually extract data from corrupt databases. I will be using the OrcaMDF RawDatabase framework to do most of the parsing, which will also be explained during the session.
If you want to be able to save the day when all other options are exhausted, you shouldn’t miss this session.
In this post I want to walk through a number of SQL Server corruption recovery techniques for when you’re out of luck, have no backups, and the usual methods don’t work. I’ll be using the AdventureWorksLT2008R2 sample database as my victim.
A Clean Start
To start out, I’ve attached the downloaded database and it’s available on my SQL Server 2008 R2 instance, under the name of AWLT2008R2.
To ensure we’ve got a clean start, I’ll run DBCC CHECKDB with the DATA_PURITY flag set, just to make sure the database is OK.
DBCC CHECKDB (AWLT2008R2) WITH ALL_ERRORMSGS, DATA_PURITY
DBCC results for'AWLT2008R2'.
Service Broker Msg 9675, State 1: Message Types analyzed: 14.
Service Broker Msg 9676, State 1: Service Contracts analyzed: 6.
Service Broker Msg 9667, State 1: Services analyzed: 3.
Service Broker Msg 9668, State 1: Service Queues analyzed: 3.
Service Broker Msg 9669, State 1: Conversation Endpoints analyzed: 0.
Service Broker Msg 9674, State 1: Conversation Groups analyzed: 0.
Service Broker Msg 9670, State 1: Remote Service Bindings analyzed: 0.
Service Broker Msg 9605, State 1: Conversation Priorities analyzed: 0.
DBCC results for'sys.sysrscols'.
There are 805 rows in9 pages for object "sys.sysrscols".
DBCC results for'sys.sysrowsets'.
There are 125 rows in1 pages for object "sys.sysrowsets".
DBCC results for'SalesLT.ProductDescription'.
There are 762 rows in18 pages for object "SalesLT.ProductDescription".
...
CHECKDB found 0 allocation errors and 0 consistency errors in database 'AWLT2008R2'.
DBCC execution completed. If DBCC printed error messages, contact your system administrator.
Enter Corruption
As I don’t want to kill my disk drives just to introduce corruption, I’ll be using OrcaMDF’s Corruptor class instead. First up we need to shut down SQL Server:
SHUTDOWN WITH NOWAIT
Server shut down by NOWAIT request from login MSR\Mark S. Rasmussen.
SQL Serveris terminating this process.
Once the instance has been shut down, I’ve located my MDF file, stored at D:\MSSQL Databases\AdventureWorksLT2008R2.mdf. Knowing the path to the MDF file, I’ll now intentially corrupt 5% of the pages in the database (at a database size of 5,312KB this will end up corrupting 33 random pages, out of a total of 664 pages).
At this point I have no idea about which pages were actually corrupted, I just know that 33 random pages just got overwritten by all zeros.
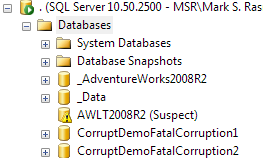
Uh Oh
After restarting the SQL Server instance and looking at the tree of databases, it’s obvious we’re in trouble…
Running DBCC CHECKDB doesn’t help much:
DBCC CHECKDB (AWLT2008R2) WITH ALL_ERRORMSGS, DATA_PURITY
Msg 926, Level 14, State 1, Line 1
Database 'AWLT2008R2' cannot be opened. It has been marked SUSPECT by recovery.
See the SQL Server errorlog for more information.
What does the errorlog say?
Starting up database ‘AWLT2008R2’.
1 transactions rolled forward in database ‘AWLT2008R2’ (13). This is an informational message only. No user action is required.
Error: 824, Severity: 24, State: 2.
SQL Server detected a logical consistency-based I/O error: incorrect pageid (expected 1:2; actual 0:0). It occurred during a read of page (1:2) in database ID 13 at offset 0x00000000004000 in file ‘D:\MSSQL Databases\AdventureWorksLT2008R2.mdf’. Additional messages in the SQL Server error log or system event log may provide more detail. This is a severe error condition that threatens database integrity and must be corrected immediately. Complete a full database consistency check (DBCC CHECKDB). This error can be caused by many factors; for more information, see SQL Server Books Online.
Error: 3414, Severity: 21, State: 1.
An error occurred during recovery, preventing the database ‘AWLT2008R2’ (database ID 13) from restarting. Diagnose the recovery errors and fix them, or restore from a known good backup. If errors are not corrected or expected, contact Technical Support.
CHECKDB for database ‘AWLT2008R2’ finished without errors on 2013-11-05 20:02:07.810 (local time). This is an informational message only; no user action is required.
Recovery is complete. This is an informational message only. No user action is required.
This is officially not good. Our database failed to recover and can’t be put online at the moment, due to I/O consistency errors. We’ve also got our first hint:
incorrectpageid (expected 1:2; actual 0:0)
What this tells us is that the header of page 2 has been overwritten by zeros since SQL Server expected to find the value 1:2, but found 0:0 instead. Page 2 is the first GAM page in the database and is an essential part of the metadata.
SQL Server also wisely told us to either fix the errors or restore from a known good backup. And this is why you should always have a recovery strategy. If you ever end up in a situation like this, without a backup, you’ll have to continue reading.
DBCC CHECKDB
SQL Server recommended that we run a full database consistency check using DBCC CHECKDB. Unfortunately, given the state of our database, DBCC CHECKDB is unable to run:
DBCC CHECKDB (AWLT2008R2) WITH ALL_ERRORMSGS, DATA_PURITY
Msg 926, Level 14, State 1, Line 1
Database 'AWLT2008R2' cannot be opened. It has been marked SUSPECT by recovery.
See the SQL Server errorlog for more information.
In some cases you may be able to force the database online, by putting it into EMERGENCY mode. If we could get the database into EMERGENCY mode, we might just be able to run DBCC CHECKDB.
ALTERDATABASE AWLT2008R2 SET EMERGENCY
Msg 824, Level 24, State 2, Line 1
SQL Server detected a logical consistency-based I/O error: incorrect pageid
(expected 1:16; actual 0:0). It occurred during areadof page (1:16) in database
ID 13atoffset0x00000000020000infile'D:\MSSQL Databases\AdventureWorksLT2008R2.mdf'.
Additional messages inthe SQL Server error logorsystem event log may provide more
detail. This is a severe error condition that threatens database integrity and must
be corrected immediately. Complete a full database consistency check (DBCC CHECKDB).
This error can be caused by many factors; for more information, see SQL Server
Books Online.
Even worse, it seems that page 16 has also been hit by corruption. Page 16 is the root page of the sysallocunits base table, holding all of the allocation unit storage metadata. Without page 16 there is no way for SQL Server to access any of its metadata. In short, there’s no way we’re getting this database online!
Enter OrcaMDF
The OrcaMDF Database class won’t be able to open the database, seeing as it does not handle corruption very well. Even so, I want to try anyway, you never know. First off you’ll have to shut down SQL Server to release the locks on the corrupt MDF file.
SHUTDOWN WITH NOWAIT
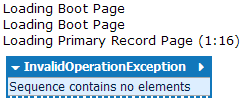
If you then try opening the database using the OrcaMDF Database class, you’ll get a result like this:
var db = new Database(@"D:\MSSQL Databases\AdventureWorksLT2008R2.mdf");
Interestingly the Database class didn’t puke on the boot page (ID 9) itself, so we know that that one’s OK, at least. But as soon as it hit page 16, things started to fall apart - and we already knew page 16 was corrupt.
RawDatabase
While the OrcaMDF Database class can’t read the database file either, RawDatabase can. RawDatabase doesn’t care about metadata, it doesn’t read anything but what you tell it to, and as a result of that, it’s much more resilient to corruption.
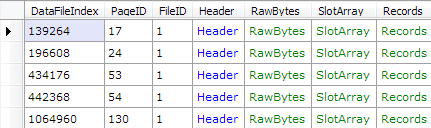
Given that we know the corruption has resulted in pages being zeroed out, we could easily gather a list of corrupted pages by just searching for pages whose logical page ID doesn’t match the one in the header:
var db = new RawDatabase(@"D:\MSSQL Databases\AdventureWorksLT2008R2.mdf")
db.Pages
  .Where(x => x.Header.PageID != x.PageID)
  .Select(x => x.PageID)
  .ToList()
  .ForEach(Console.WriteLine);
2451655...639649651662663
This is only possible since we know the corruption caused pages to be zeroed out, so you’ll rarely be this lucky. However, sometimes you may be able to detect the exact result of the corruption, thus enabling you to pinpoint the corrupted pages, just like we did here. However, this doesn’t really help us much - all we have now is a list of some page ID’s that are useless to us.
Getting a List of Objects
For this next part we’ll need a working database, any database, on an instance running the same version that our corrupted database this. This could be the master database - literally any working database. First you’ll want to connect to the database using the Dedicated Administrator Connection.aspx). Connecting through the DAC allows us to query the base tables of the database.
The base table beneath sys.tables is called sys.sysschobjs, and if we can get to that, we can get a list of all the objects in the database, which might be a good start. Having connected to the working database, we can get the sys.sysschobjs details like so:
SELECT * FROM sys.sysschobjs WHERE name = 'sysschobjs'
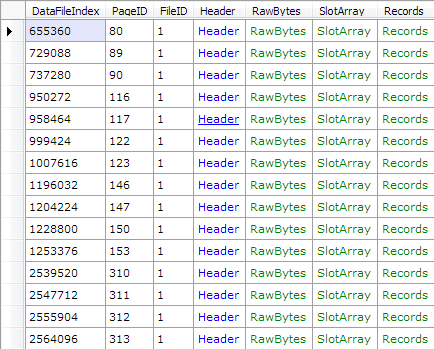
The only thing I’m looking for here is the object id, provided by the id column. In contrast to all user tables, the system tables have their actual object id stored in the page header, which allows us to easily query for pages by their id. Knowing sys.sysschobjs has ID 34, let’s see if we can get a list of all the pages belonging to it (note that the .Dump() method is native to LinqPad - all it does is to output the resulting objects as a table):
var db = new RawDatabase(@"D:\MSSQL Databases\AdventureWorksLT2008R2.mdf");
db.Pages
  .Where(x => x.Header.ObjectID == 34)
  .Dump();
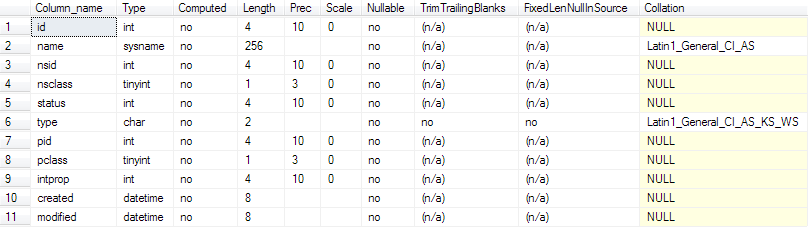
Now that we have a list of pages belonging to the sys.sysschobjs table, we need to retrieve the actual rows from there. Using sp_help on the working database, we can see the underlying schema of sys.sysschobjs:
sp_help 'sys.sysschobjs'
Once we have the schema of sys.sysschobjs, we can make RawDatabase parse the actual rows for us, after which we can filter it down to just the user tables, seeing as we don’t care about procedures, views, indexes and so forth:
var db = new RawDatabase(@"D:\MSSQL Databases\AdventureWorksLT2008R2.mdf");
var pages = db.Pages.Where(x => x.Header.ObjectID == 34 && x.Header.Type == PageType.Data);
var records = pages.SelectMany(x => x.Records).Select(x => (RawPrimaryRecord)x);
var rows = RawColumnParser.Parse(records, new IRawType[] {
	RawType.Int("id"),
	RawType.NVarchar("name"),
	RawType.Int("nsid"),
	RawType.TinyInt("nsclass"),
	RawType.Int("status"),
	RawType.Char("type", 2),
	RawType.Int("pid"),
	RawType.TinyInt("pclass"),
	RawType.Int("intprop"),
	RawType.DateTime("created"),
	RawType.DateTime("modified")
});

rows.Where(x => x["type"].ToString().Trim() == "U")
	.Select(x => new {
		ObjectID = (int)x["id"],
		Name = x["name"]
	}).Dump();
We just went from a completely useless suspect database, with no knowledge of the schema, to now having a list of each user table name & object id. Sure, if one of the pages belonging to sys.syschobjs was corrupt, we’d be missing some of the tables without knowing it. Even so, this is a good start, and there are ways of detecting the missing pages (we could look for broken page header references, for example).
Getting Schemas
As we saw for sys.sysschobjs, if we are to parse any of the user table data, we need to know the schema of the tables. The schema happens to be stored in the sys.syscolpars base table, and if we lookup in sys.sysschobjs for ‘sys.syscolpars’, we’ll get an object ID of 41. As we did before, we can get a list of all pages belonging to sys.syscolpars:
var db = new RawDatabase(@"D:\MSSQL Databases\AdventureWorksLT2008R2.mdf");
db.Pages
  .Where(x => x.Header.ObjectID == 41)
  .Dump();
By looking up the schema of sys.syscolpars using sp_help, in the working database, we can parse the actual rows much the same way:
// Parse sys.syscolparsvar db = new RawDatabase(@"D:\MSSQL Databases\AdventureWorksLT2008R2.mdf");
var pages = db.Pages.Where(x => x.Header.ObjectID == 41 && x.Header.Type == PageType.Data);
var records = pages.SelectMany(x => x.Records).Select(x => (RawPrimaryRecord)x);
var rows = RawColumnParser.Parse(records, new IRawType[] {
RawType.Int("id"),
RawType.SmallInt("number"),
RawType.Int("colid"),
RawType.NVarchar("name"),
RawType.TinyInt("xtype"),
RawType.Int("utype"),
RawType.SmallInt("length"),
RawType.TinyInt("prec"),
RawType.TinyInt("scale"),
RawType.Int("collationid"),
RawType.Int("status"),
RawType.SmallInt("maxinrow"),
RawType.Int("xmlns"),
RawType.Int("dflt"),
RawType.Int("chk"),
RawType.VarBinary("idtval")
});
rows.Select(x => new {
ObjectID = (int)x["id"],
ColumnID = (int)x["colid"],
Number = (short)x["number"],
TypeID = (byte)x["xtype"],
Length = (short)x["length"],
Name = x["name"]
}).Dump();
Recovering the Customer Table Schema
While there are 12 tables, none are probably more important than the Customer table. Based on parsing the sys.sysschobjs base table, we know that the customer table has an object ID of 117575457. Let’s try and filter down to just that object ID, using the code above:
rows.Where(x => (int)x["id"] == 117575457).Select(x => new {
	ObjectID = (int)x["id"],
	ColumnID = (int)x["colid"],
	Number = (short)x["number"],
	TypeID = (byte)x["xtype"],
	Length = (short)x["length"],
	Name = x["name"]
}).OrderBy(x => x.Number).Dump();
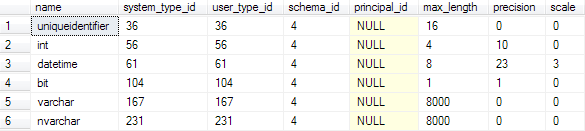
Running the following query in any working database, we can correlate the TypeID values with the SQL Server type names:
SELECT
	*
FROM
	sys.types
WHERE
	system_type_id IN (56, 104, 231, 167, 36, 61) AND
	system_type_id = user_type_id
Using the output from syscolpars and the type names, we can now deduce the schema of the Customer table (note that the syscolpars lengths are physical, meaning a length of 16 for an nvarchar column means a logical length of 8):
All we need now is to find the pages belonging to the Customer table. That’s slightly easier said than done however. While each object has an object ID, as can be verified using sys.sysschobjs, that object ID is not what’s stored in the page headers, except for system objects. Thus we can’t just query for all pages whose Header.ObjectID == 117575457, as the value 117575457 won’t be stored in the header.
Recovering the Customer Allocation Unit
To find the pages belonging to the Customer table, we’ll first need to find the allocation unit to which it belongs. Unfortunately we already know that page 16 is corrupt - the first page of the sys.sysallocunits table, containing all of the metadata. However, we might just be lucky enough for that first page to contain the allocation units for all of the internal tables, which we do not care about. Let’s see if there are any other pages belonging to sys.sysallocunits:
var db = new RawDatabase(@"D:\MSSQL Databases\AdventureWorksLT2008R2.mdf");
db.Pages
  .Where(x => x.Header.ObjectID == 7)
  .Dump();
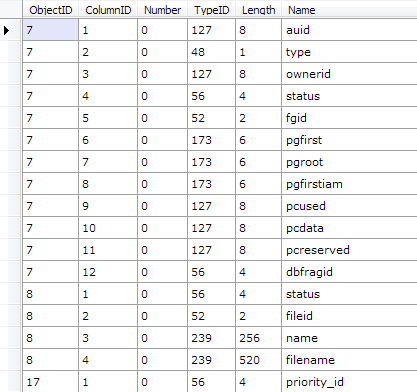
There are 5 other pages available. Let’s try and parse them out so we have as much of the allocation unit data available, as possible. Once again we’ll get the schema from the working database, using sp_help, after which we can parse the remaining rows using RawDatabase. By looking up ‘sysallocunits’ in sysschobjs, we know it has an object ID of 7:
var db = new RawDatabase(@"D:\MSSQL Databases\AdventureWorksLT2008R2.mdf");
var pages = db.Pages.Where(x => x.Header.ObjectID == 7 && x.Header.Type == PageType.Data);
var records = pages.SelectMany(x => x.Records).Select(x => (RawPrimaryRecord)x);
var rows = RawColumnParser.Parse(records, new IRawType[] {
RawType.BigInt("auid"),
RawType.TinyInt("type"),
RawType.BigInt("ownerid"),
RawType.Int("status"),
RawType.SmallInt("fgid"),
RawType.Binary("pgfirst", 6),
RawType.Binary("pgroot", 6),
RawType.Binary("pgfirstiam", 6),
RawType.BigInt("pcused"),
RawType.BigInt("pcdata"),
RawType.BigInt("pcreserved"),
RawType.Int("dbfragid")
});
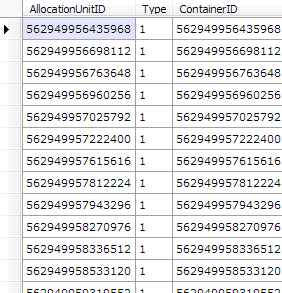
rows.Select(x => new {
AllocationUnitID = (long)x["auid"],
Type = (byte)x["type"],
ContainerID = (long)x["ownerid"]
}).Dump();
By itself, we can’t use this data, but we’ll need it in just a moment. First we need to get a hold of the Customer table partitions as well. We do so by looking up the schema of sys.sysrowsets using sp_help, after which we can parse it. Looking up ‘sysrowsets’ in sysschobjs, we know that sys.sysrowsets has an object ID of 5:
var db = new RawDatabase(@"D:\MSSQL Databases\AdventureWorksLT2008R2.mdf");
var pages = db.Pages.Where(x => x.Header.ObjectID == 5 && x.Header.Type == PageType.Data);
var records = pages.SelectMany(x => x.Records).Select(x => (RawPrimaryRecord)x);
var rows = RawColumnParser.Parse(records, new IRawType[] {
RawType.BigInt("rowsetid"),
RawType.TinyInt("ownertype"),
RawType.Int("idmajor"),
RawType.Int("idminor"),
RawType.Int("numpart"),
RawType.Int("status"),
RawType.SmallInt("fgidfs"),
RawType.BigInt("rcrows"),
RawType.TinyInt("cmprlevel"),
RawType.TinyInt("fillfact"),
RawType.SmallInt("maxnullbit"),
RawType.Int("maxleaf"),
RawType.SmallInt("maxint"),
RawType.SmallInt("minleaf"),
RawType.SmallInt("minint"),
RawType.VarBinary("rsguid"),
RawType.VarBinary("lockres"),
RawType.Int("dbfragid")
});
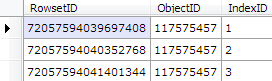
rows.Where(x => (int)x["idmajor"] == 117575457).Select(x => new {
RowsetID = (long)x["rowsetid"],
ObjectID = (int)x["idmajor"],
IndexID = (int)x["idminor"]
}).Dump();
By filtering down to just the Customer table’s object ID, we’ve now got the three partitions that belongs to the table - one for each allocation unit type - ROW_OVERFLOW_DATA (3), LOB_DATA (2) and IN_ROW_DATA (1). We don’t care about LOB and SLOB for now, all we need is the IN_ROW_DATA partition - giving us a RowsetID value of 72057594039697408.
Now that we have the RowsetID, let’s lookup the allocation unit using the data we got from sys.sysallocunits earlier on:
var db = new RawDatabase(@"D:\MSSQL Databases\AdventureWorksLT2008R2.mdf");
var pages = db.Pages.Where(x => x.Header.ObjectID == 7 && x.Header.Type == PageType.Data);
var records = pages.SelectMany(x => x.Records).Select(x => (RawPrimaryRecord)x);
var rows = RawColumnParser.Parse(records, new IRawType[] {
RawType.BigInt("auid"),
RawType.TinyInt("type"),
RawType.BigInt("ownerid"),
RawType.Int("status"),
RawType.SmallInt("fgid"),
RawType.Binary("pgfirst", 6),
RawType.Binary("pgroot", 6),
RawType.Binary("pgfirstiam", 6),
RawType.BigInt("pcused"),
RawType.BigInt("pcdata"),
RawType.BigInt("pcreserved"),
RawType.Int("dbfragid")
});
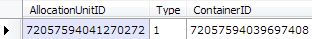
rows.Where(x => (long)x["ownerid"] == 72057594039697408).Select(x => new {
AllocationUnitID = (long)x["auid"],
Type = (byte)x["type"],
ContainerID = (long)x["ownerid"]
}).Dump();
var allocationUnitID = 72057594041270272;
var indexID = allocationUnitID >> 48;
var objectID = (allocationUnitID - (indexID << 48)) >> 16;

Console.WriteLine("IndexID: " + indexID);
Console.WriteLine("ObjectID: " + objectID);
IndexID: 256ObjectID: 51
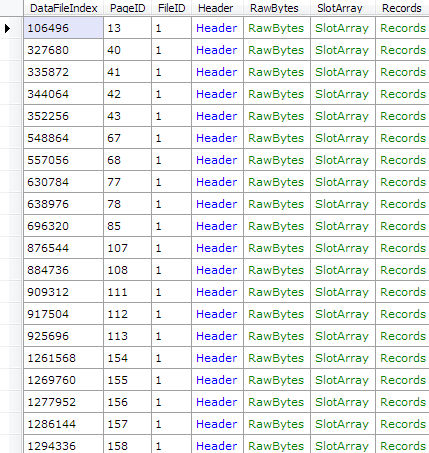
Now that we have not only the object ID, but also the index ID, we can easily get a list of all the pages belonging to the Customer table:
var db = new RawDatabase(@"D:\MSSQL Databases\AdventureWorksLT2008R2.mdf");
db.Pages
  .Where(x => x.Header.ObjectID == 51 && x.Header.IndexID == 256)
  .Dump();
And since we already know the schema for the Customer table, it’s a simple matter of making RawDatabase parse the actual rows:
var db = new RawDatabase(@"D:\MSSQL Databases\AdventureWorksLT2008R2.mdf");
var pages = db.Pages.Where(x => x.Header.ObjectID == 51 && x.Header.IndexID == 256 && x.Header.Type == PageType.Data);
var records = pages.SelectMany(x => x.Records).Select(x => (RawPrimaryRecord)x);
var rows = RawColumnParser.Parse(records, new IRawType[] {
RawType.Int("CustomerID"),
RawType.Bit("NameStyle"),
RawType.NVarchar("Title"),
RawType.NVarchar("FirstName"),
RawType.NVarchar("MiddleName"),
RawType.NVarchar("LastName"),
RawType.NVarchar("Suffix"),
RawType.NVarchar("CompanyName"),
RawType.NVarchar("SalesPerson"),
RawType.NVarchar("EmailAddress"),
RawType.NVarchar("Phone"),
RawType.Varchar("PasswordHash"),
RawType.Varchar("PasswordSalt"),
RawType.UniqueIdentifier("rowguid"),
RawType.DateTime("ModifiedDate")
});
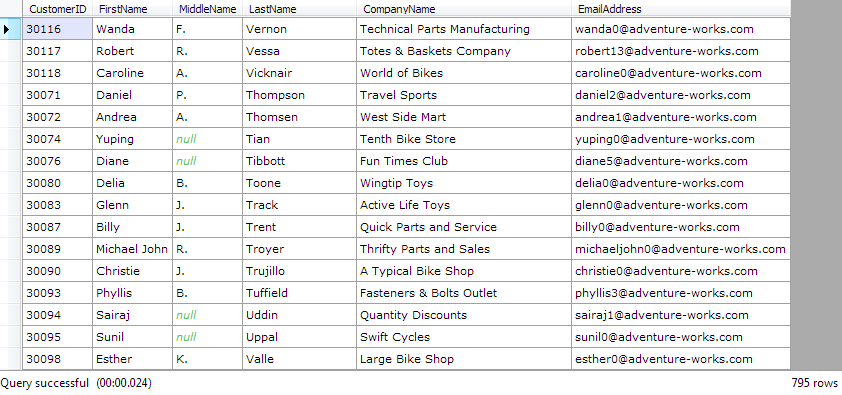
rows.Select(x => new {
CustomerID = (int)x["CustomerID"],
FirstName = (string)x["FirstName"],
MiddleName = (string)x["MiddleName"],
LastName = (string)x["LastName"],
CompanyName = (string)x["CompanyName"],
EmailAddress = (string)x["EmailAddress"]
}).Dump();
And there we have it. 795 customers were just recovered from an otherwise unrecoverable state. Now it’s just a matter of repeating this process for the other tables as well.
Summary
As I’ve just shown, even though all hope seems lost, there are still options. If you know what you’re doing, a tool like OrcaMDF, or another homebrewn solution, might come in as an invaluable out, during a disaster. This is not, and should never be, a replacement for a good recovery strategy. That being said, not a week goes by without someone posting on a forum somewhere about a corrupt database without any backups.
In this case we went from fatal corruption to recovering 795 customers from the Customer table. Looking at the database, before it was corrupted, there was originally 847 customers in the table. Thus 52 customers were lost due to the corruption. If the pages really are hit by corruption, nothing will get that data back, unless you have a backup. However, if you’re unlucky and end up with metadata corruption, and/or a database that won’t come online, this may be a viable solution.
Should you come across a situation where OrcaMDF might come in handy, I’d love to hear about it - nothing better to hear than success stories! If you don’t feel like going through this process yourself, feel free to contact me; I may be able to help.
Sometimes you must first do evil, to do good. Such is the case when you want to hone your skills in corruption recovery of SQL Server databases.
To give me more material to test the new RawDatabase functionality, I’ve now added a Corruptor class to OrcaMDF. Corruptor does more or less what the name says - it corrupts database files on purpose.
The corruption itself is quite simple. Corruptor will choose a number of random pages and simply overwrite the page completely with all zeros. Depending on what pages are hit, this can be quite fatal.
I shouldn’t have to say this, but just in case… Please do not use this on anything valuable. It will fatally corrupt your data.
Examples
There are two overloads for the Corruptor.CorruptFile method, both of them return an IEnumerable of integers - a list of the page IDs that have been overwritten by zeros.
The following code will corrupt 5% of the pages in the AdventureWorks2008R2LT.mdf file, after which it will output each page ID that has been corrupted. You can specify the percentage of pages to corrupt by changing the second parameter.
var corruptedPageIDs = Corruptor.CorruptFile(@"C:\AdventureWorks2008R2LT.mdf", 0.05);
Console.WriteLine(string.Join(", ", corruptedPageIDs));
To make the corruption hit even harder, you can also use the second overload of the CorruptFile method, allowing you to specify the exact number of pages to corrupt, within a certain range of page IDs. The following code will corrupt exactly 10 pages within the first 50 pages (zero-based), thus hitting mostly metadata.
var corruptedPageIDs = Corruptor.CorruptFile(@"C:\AdventureWorks2008R2LT.mdf", 10, 0, 49);
Console.WriteLine(string.Join(", ", corruptedPageIDs));
16, 4, 0, 32, 15, 14, 30, 2, 49, 9
In the above case I was extraordinarily unlucky seeing as page 0 is the file header page, page 2 is the first GAM page, page 9 is the boot page and finally page 16 is the page that contains the allocation unit metadata. With corruption like this, you can be certain that DBCC CHECKDB will be giving up, leaving you with no other alternative than to restore from a backup.
Or… You could try to recover as much data as possible using OrcaMDF RawDatabase, but I’ll get back to that later :)
When I initially started working on OrcaMDF I had just one goal, to gain a deeper knowledge of MDF file internals than I could through most books available.
As time progressed, so did OrcaMDF. While I had no initial plans of doing so, OrcaMDF has ended up being capable of parsing base tables, metadata and even dynamically recreating common DMVs. On top of this, I made a simple GUI, just to make OrcaMDF easier to use.
While that’s great, it comes at the price of extreme complexity. To be able to automatically parse table metadata like schemas, partitions, allocation units and more, not to mention abstracting away details like heaps and indexes, it takes a lot of code and it requires intimate knowledge of the database itself. Seeing as metadata changes between versions, OrcaMDF currently only supports SQL Server 2008 R2. While the data structures themselves are rather stable, there are minor differences in the way metadata is stored, the data exposed by DMVs and so forth. And on top of this, requiring all of the metadata to be perfect, for OrcaMDF to work, results in OrcaMDF being just as vulnerable to corruption as SQL Server is itself. Got a corrupt boot page? Neither SQL Server nor OrcaMDF will be able to parse the database.
Say Hello to RawDatabase
I tried to imagine the future of OrcaMDF and how to make it the most useful. I could march on make it support more and more of the same features that SQL Server does, eventually being able to parse 100% of an MDF file. But what would the value be? Sure, it would be a great learning opportunity, but the thing is, if you’ve got a working database, SQL Server does a pretty good job too. So what’s the alternative?
RawDatabase, in contrast to the Database class, doesn’t try to parse anything besides what you tell it to. There’s no automatic parsing of schemas. It doesn’t know about base tables. It doesn’t know about DMVs. It does however know about the SQL Server data structures and it gives you an interface for working with the MDF file directly. Letting RawDatabase parse nothing but the data structures means it’s significantly less vulnerable to corruption or bad data.
Examples
It’s still early in the development, but let me show some examples of what can be done using RawDatabase. While I’m running the code in LINQPad, as that makes it easy to show the results, the result are just standard .NET objects. All examples are run against the AdventureWorks 2008R2 LT (Light Weight) database.
Getting a Single Page
In the most basic example, we’ll parse just a single page.
// Get page 197 in file 1var db = new RawDatabase(@"C:\AWLT2008R2.mdf");
db.GetPage(1, 197).Dump();
Parsing the Page Header
Now that we’ve got a page, how about we dump the header values?
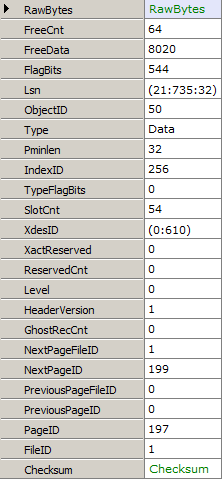
// Get the header of page 197 in file 1var db = new RawDatabase(@"C:\AWLT2008R2.mdf");
db.GetPage(1, 197).Header.Dump();
Parsing the Slot Array
Just as the header is available, you can also get the raw slot array entries.
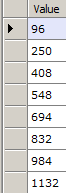
// Get the slot array entries of page 197 in file 1var db = new RawDatabase(@"C:\AWLT2008R2.mdf");
db.GetPage(1, 197).SlotArray.Dump();
Parsing Records
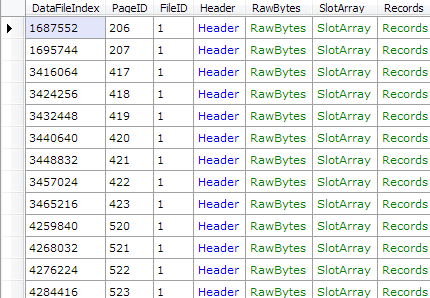
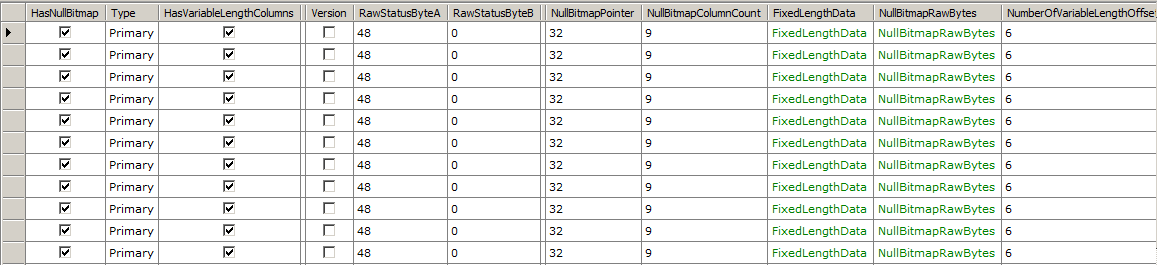
While getting the raw slot array entries can be useful, you’ll usually want to look at the records themselves. Fortunately, that’s easy to do too.
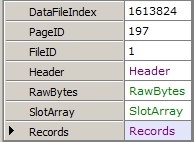
// Get all records on page 197 in file 1var db = new RawDatabase(@"C:\AWLT2008R2.mdf");
db.GetPage(1, 197).Records.Dump();
Retrieving Data from Records
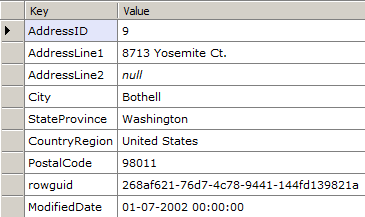
Once you’ve got the records, you could now access the FixedLengthData or the VariableLengthOffsetValues properties to get the raw fixed length and variable length column values. However, what you’ll typically want is to get the actually parsed values. To spare you the work, OrcaMDF can parse it for you, if you just provide it the schema.
// Read the record contents of the first record on page 197 of file 1var db = new RawDatabase(@"C:\AWLT2008R2.mdf");
RawPrimaryRecord firstRecord = (RawPrimaryRecord)db.GetPage(1, 197).Records.First();
var values = RawColumnParser.Parse(firstRecord, new IRawType[] {
RawType.Int("AddressID"),
RawType.NVarchar("AddressLine1"),
RawType.NVarchar("AddressLine2"),
RawType.NVarchar("City"),
RawType.NVarchar("StateProvince"),
RawType.NVarchar("CountryRegion"),
RawType.NVarchar("PostalCode"),
RawType.UniqueIdentifier("rowguid"),
RawType.DateTime("ModifiedDate")
});
values.Dump();
RawColumnParser.Parse will, given a schema, automatically convert the raw bytes into a Dictionary<string, object>, the key being the column name from the schema and the value being the actual type of the column, e.g. int, short, Guid, string, etc. By letting you, the user, specify the schema, OrcaMDF can get rid of a slew of dependencies on metadata, thus ignoring any possible corruption in metadata. Given the availability of the Next & PreviousPageID properties of the header, it would be simple to iterate through all linked pages, parsing all records of each page - basically performing a scan on a given allocation unit.
Filtering Pages
Besides retrieving a specific page, RawDatabase also has a Pages property that enumerates over all pages in a database. Using this you could, for example, get a list of all IAM pages in the database.
// Get a list of all IAM pages in the databasevar db = new RawDatabase(@"C:\AWLT2008R2.mdf");
db.Pages
.Where(x => x.Header.Type == PageType.IAM)
.Dump();
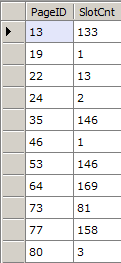
And since this is powered by LINQ, it’s easy to project just the properties you want. For example, you could get all index pages and their slot counts like this:
// Get all index pages and their slot countsvar db = new RawDatabase(@"C:\AWLT2008R2.mdf");
db.Pages
.Where(x => x.Header.Type == PageType.Index)
.Select(x => new {
x.PageID,
x.Header.SlotCnt
}).Dump();
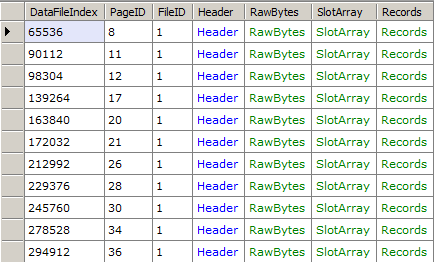
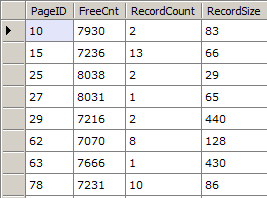
Or let’s say you wanted to get all data pages with at least one record and more than 7000 bytes of free space - with the page id, free count, record count and average record size as the output:
var db = new RawDatabase(@"C:\AWLT2008R2.mdf");
db.Pages
	.Where(x => x.Header.FreeCnt > 7000)
	.Where(x => x.Header.SlotCnt >= 1)
	.Where(x => x.Header.Type == PageType.Data)
	.Select(x => new {
	    x.PageID,
		x.Header.FreeCnt,
		RecordCount = x.Records.Count(),
		RecordSize = (8096 - x.Header.FreeCnt) / x.Records.Count()
	}).Dump();
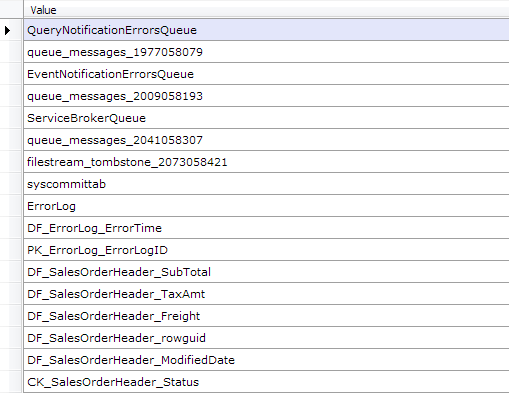
And as a final example, imagine you’ve got just an MDF file but you seem to have forgotten what objects are stored inside of it. Fret not, we’ll just get the data from the sysschobjs base table! Sysschobjs is the base table that stores all object data, and fortunately it has a static object ID of 34. Using this, we can filter down to all of the data pages for object 34, get all the records and then parse just the two first columns of the schema (you may specify a partial schema, as long as you only omit columns at the end), ending up in us dumping just the names (we could of course have gotten the full schema, if we wanted to).
var db = new RawDatabase(@"C:\AWLT2008R2.mdf");

var records = db.Pages
	.Where(x => x.Header.ObjectID == 34 && x.Header.Type == PageType.Data)
	.SelectMany(x => x.Records);

var rows = records.Select(x => RawColumnParser.Parse((RawPrimaryRecord)x, new IRawType[] {
	RawType.Int("id"),
	RawType.NVarchar("name")
}));

rows.Select(x => x["name"]).Dump();
Compatibility
Seeing as RawDatabase doesn’t rely on metadata, it’s much easier to support multiple SQL Server versions. Thus, I’m happy to say that RawDatabase fully supports SQL Server 2005, 2008, 2008R2 and 2012. It probably supports 2014 too, I just haven’t tested that. Speaking of testing, all unit tests are automatically run against AdventureWorksLT for both 2005, 2008, 2008R2 and 2012 during testing. Right now there are tests demonstrating that OrcaMDF RawDatabase is able to parse the first record of each and every table in the AdventureWorks LT databases.
Corruption
One of the really interesting use cases for RawDatabase is in the case of corrupted databases. You could filter pages on the object id you’re searching for and then brute-force parse each of them, retrieving whatever data is readable. If metadata is corrupted, you could ignore it, provide the schema manually and the just follow the linked lists of pages, or parse the IAM pages to read heaps. During the next couple of weeks I’ll be blogging more on OrcaMDF RawDatabase to show various use case examples, including ones on corruption.
Source & Feedback
I’m really excited about the new RawDatabase addition to OrcaMDF and I hope I’m not the only one who can see the potential. If you try it out, have any ideas, suggestions or other kinds of feedback, I’d love to hear it.
If you want to try it out, head on over to the OrcaMDF project on GitHub. Once it’s just a bit more polished, I’ll make it available on NuGet as well. Just like the rest of OrcaMDF, the code is licensed under GPL v3.
I love presenting, especially so when it’s possible for me to do so alongside Powerpoints presenters view. Unfortunately I’m an even bigger fan of ZoomIt and I use it extensively when presenting. Why is that an issue? To use ZoomIt effectively, not just in demos but when showing slides as well, I need to duplicate my screen rather than extending it. Duplicating the screen means presenters view is not an option :(
Introducing PowerPad
Seeing as I’ve already got my iPad next to me when presenting it seems obvious to use that for the presenters view. However, even though I’ve scoured the app store for solutions, I have yet to find something that doesn’t require me to install invasive clients on my computer or suffice with a fixed & lagging UI on the iPad. Even worse, most require me to pay up front, meaning I can’t perform a meaningful trial.
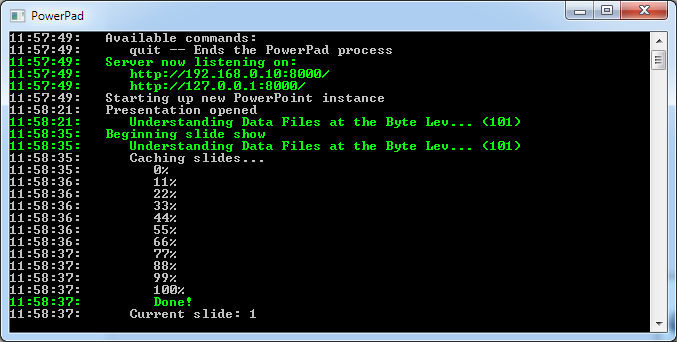
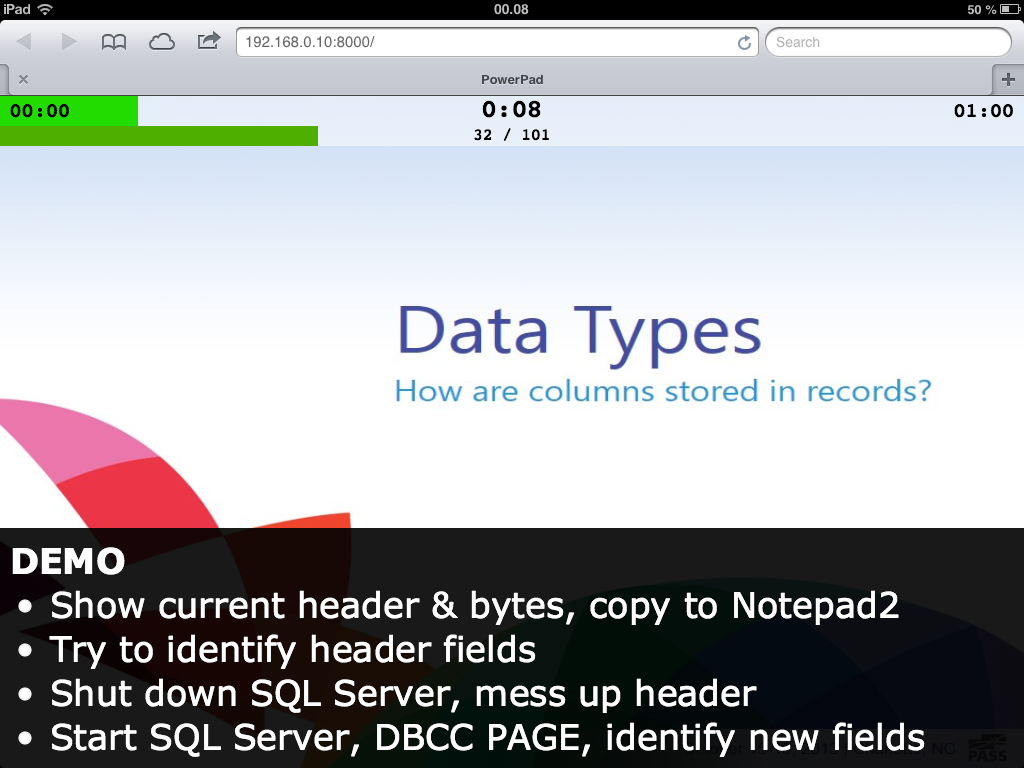
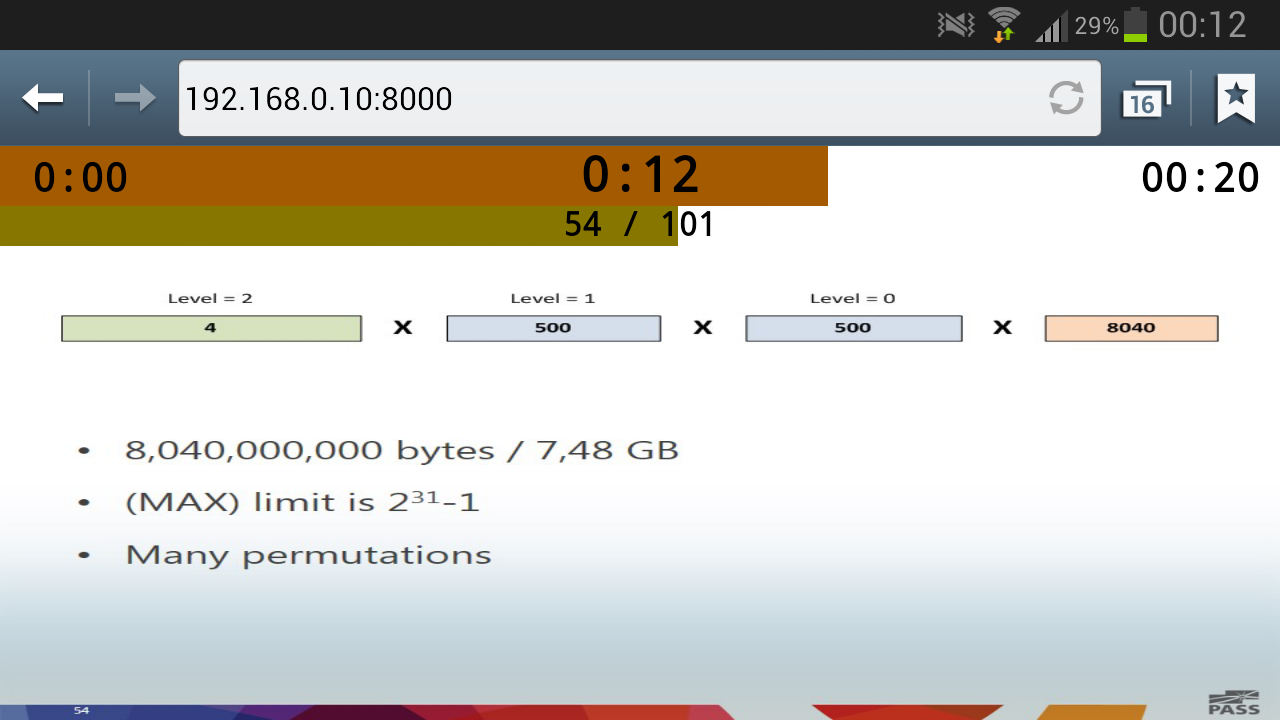
And so I decided to do something about it. PowerPad is a simple console application that runs on your computer, detects when you run a presentation and automatically provides a “presenters view” served over HTTP. The overall goal for PowerPad is to provide a Powerpoint presenters view for tablets & phones.
As soon as you’re running PowerPad, and a presentation, you’ll now be able to access the host IP through any device with a browser. I personally use my iPad:
And in a pinch I might even use my phone:
Getting Started
PowerPad is open source and completely free to use, licensed under the MIT license. It currently supports Powerpoint 2013 and only requires you to have the .NET 2.0 Framework installed. As long as your devices are on the same network, you can hook up any number of secondary monitors to your presentation - even your attendees, should you want to.
For more screenshots as well as the code & downloads, please check out the PowerPad page on Github.
I’m slightly late to announce this, but better late than never!
Just a few weeks ago, the book Tribal SQL went for sale! I authored a chapter on “Storage Internals 101” and alongside 14 other first-time authors, this is our first book to have published!
Tribal SQL: New voices in SQL Server
15 first-time authors answer the question: What makes you passionate about working with SQL Server?
MidnightDBA and Red Gate partnered to produce a book filled with community, Tribal, knowledge on SQL Server. The resulting book is a series of chapters on lessons learned, perhaps the hard way, which you won’t find in traditional training or technical guidance material.
As a truly community-driven book, the authors are all generously donating 100% of their royalties to the charity Computers 4 Africa.
A DBA’s core responsibilities are constant. A DBA must have the hard skills necessary to maintain and enforce security mechanisms on the data, prepare effectively for disaster recovery, ensure the performance and availability of all the databases in their care.
Side by side with these, our authors have also recognized the importance of communication skills to the business and their careers. We have chapters on the importance to a DBA of communicating clearly with their co-workers and business leaders, presenting data as useful information that the business can use to make decisions, and sound project management skills.
The resulting book, Tribal SQL, is a reflection of how a DBA’s core and long-standing responsibilities and what it means to be a DBA in today’s businesses.